Technology Configuration Status Donut Chart – Market and Competitive Analysis
RJ0900015_7
- Last Update 08/20/2025
- File Size 1.3MB
- # of Slides 2
- File Format PPTX
- Slide Ratio 16:9
- Color
Keywords
- #Content-Based Slides
- #Design-Based Slides
- #Business Introduction
- #Market and Competitor Analysis
- #Graph
- #Technological Status
- #Market Status
- #Circles
- #Doughnut Chart
- #16:9
- #donut chart PowerPoint
- #pie chart slide template
- #technology configuration analysis
- #market share donut chart
- #competitive analysis graph
- #ratio visualization PowerPoint slide
About the Product
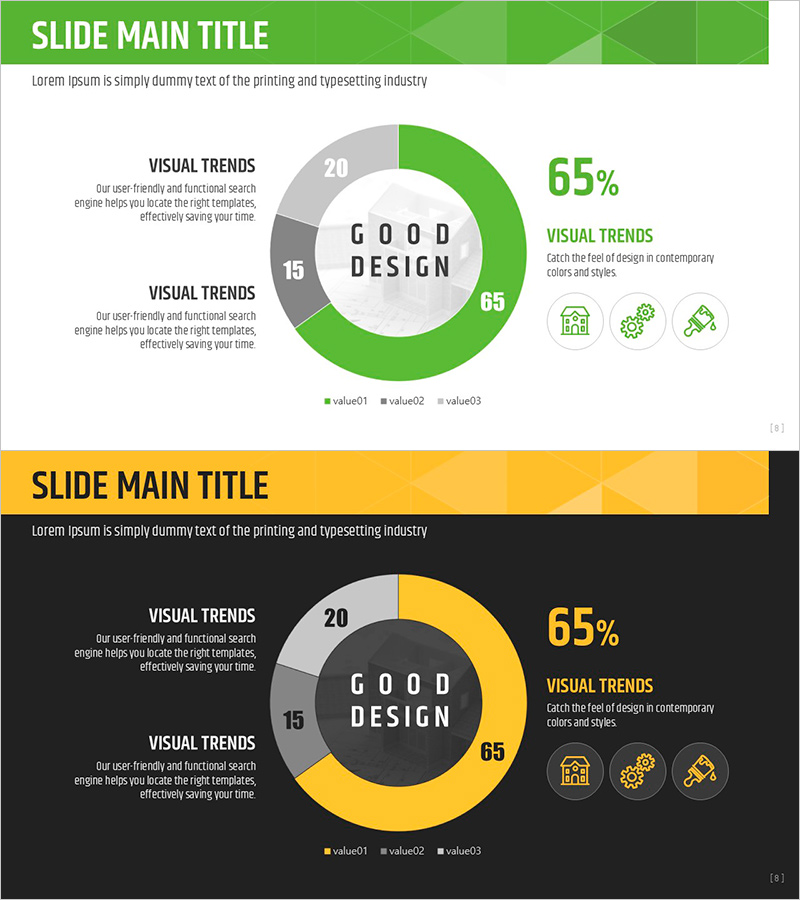
A PowerPoint slide featuring a 3-segment donut chart for visualizing technology configuration status and market analysis. The design uses green and gray tones to emphasize key metrics (65%, 20%, 15%), with a central circular area for core messaging. This presentation slide is optimized for ratio-based data representation in market analysis, competitive benchmarking, and technology status reports. The 2-slide set provides multiple color variations (green background and black background) in 16:9 widescreen format, ready for immediate use in business presentations and strategic planning documents.
Usage Points
-
Main Usage
Visualizes three key metrics (technology composition, market share, competitive positioning) as percentage-based donut segments to enable quick data comprehension. The centered circular area accommodates titles like 'Technology Configuration' to clarify chart intent and data context.
-
How to Use
Insert numerical data into the donut chart segments for technology stack analysis, market research findings, or competitive landscape sections. Apply the green-background slide for positive-tone presentations and the black-background variant for premium, executive-level reporting environments.
-
Recommended For
Technology managers, marketing strategists, business analysts, investment pitch presenters, and strategic planning teams preparing data-driven decision materials. Particularly effective for technology stack composition, market penetration rates, customer segmentation analysis, and competitive positioning reports.
-
Slide Structure
Two-slide set with Slide 1 featuring a green background, 3-segment donut chart (65%, 20%, 15% data points), left-aligned text area, and three right-aligned icons. Slide 2 presents the same donut structure on a black background with yellow accent tones, providing color variation options for different presentation contexts.
Related Products
-

Demand Charts in Region – A Convincing Tool for Market Analysis
#Market and Competitor Analysis #Graph #Other
-

Visualizing Market Share with Detailed Item Analysis Chart
#Market and Competitor Analysis #Diagram #Graph
-

Visualizing Market Share with Plus Donut Chart
#Market and Competitor Analysis #Diagram #Graph
-

Violin Donut Chart – Effective Data Visualization
#Product/Service Introduction #Business Introduction #Graph
