Camping Business Step-by-Step Future Plan Donut Chart
RJ0600032_31
- Last Update 06/29/2025
- File Size 1.2MB
- # of Slides 2
- File Format PPTX
- Slide Ratio 16:9
- Color
Keywords
- #Content-Based Slides
- #Design-Based Slides
- #Market and Competitor Analysis
- #Financial Plans and Performance
- #Graph
- #Market Status
- #Projected Return on Investment (ROI)
- #Circles
- #Doughnut Chart
- #16:9
- #donut chart PowerPoint
- #donut chart slide template
- #pie chart presentation
- #ratio visualization PPT
- #progress rate chart
- #how to create donut chart in PowerPoint
About the Product
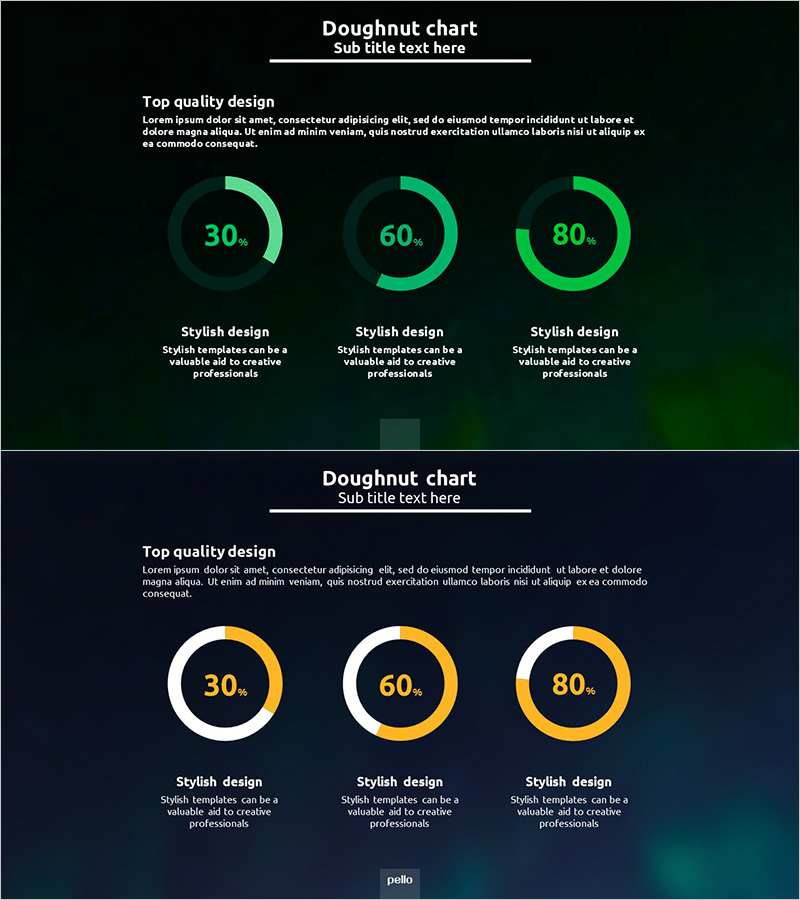
A donut chart PowerPoint slide designed to visualize business progress by stage and goal achievement rates. This presentation template features two layout variations (green tone and orange tone) displaying three ratio levels: 30%, 60%, and 80%, with descriptive text areas below each chart. Ideal for camping business plans, financial reports, market analysis, and performance presentations. The slide deck is optimized for 16:9 widescreen format and fully editable in PPTX format, allowing you to customize all elements to match your specific data and messaging needs.
Usage Points
-
Main Usage
Visualize business progress by stage, goal achievement rates, and market share percentages using intuitive donut chart graphics. The 30%, 60%, 80% ratio representations make numerical data immediately understandable to your audience.
-
How to Use
Insert this slide into camping business plans, financial reports, market analysis documents, and performance reviews. Replace the placeholder percentages and text descriptions with your actual data to communicate progress and achievements clearly.
-
Recommended For
Business planners, financial analysts, marketing professionals, and consultants presenting quarterly reports, investor pitches, and strategic planning meetings where data-driven progress visualization is essential.
-
Slide Structure
Two slide layouts with three donut charts arranged horizontally on each slide. Each chart displays a percentage (30%, 60%, 80%) with title and description text areas positioned below. First layout uses green color palette; second uses orange palette for visual variety.
Related Products
-

Market Status Chart for Point Frame
#Market and Competitor Analysis #Financial Plans and Performance #Diagram
-

Visually Appealing Presentation Slide – Stylish Design
#Product/Service Introduction #Market and Competitor Analysis #Graph
-

Market Share Analysis Graph by Technology – Competition and Collaboration
#Market and Competitor Analysis #Diagram #Graph
-

Visualizing Market Share with Detailed Item Analysis Chart
#Market and Competitor Analysis #Diagram #Graph
