Technology Flow Donut Chart – Market Share Analysis
RJ0900014_9
- Last Update 08/20/2025
- File Size 3MB
- # of Slides 2
- File Format PPTX
- Slide Ratio 16:9
- Color
Keywords
- #Content-Based Slides
- #Design-Based Slides
- #Operational Plan
- #Market and Competitor Analysis
- #Graph
- #Production and Technology Development Strategy
- #Market Share
- #Circles
- #Doughnut Chart
- #16:9
- #donut chart PowerPoint
- #pie chart slide template
- #market share visualization
- #technology flow diagram
- #4-segment circular graph
About the Product
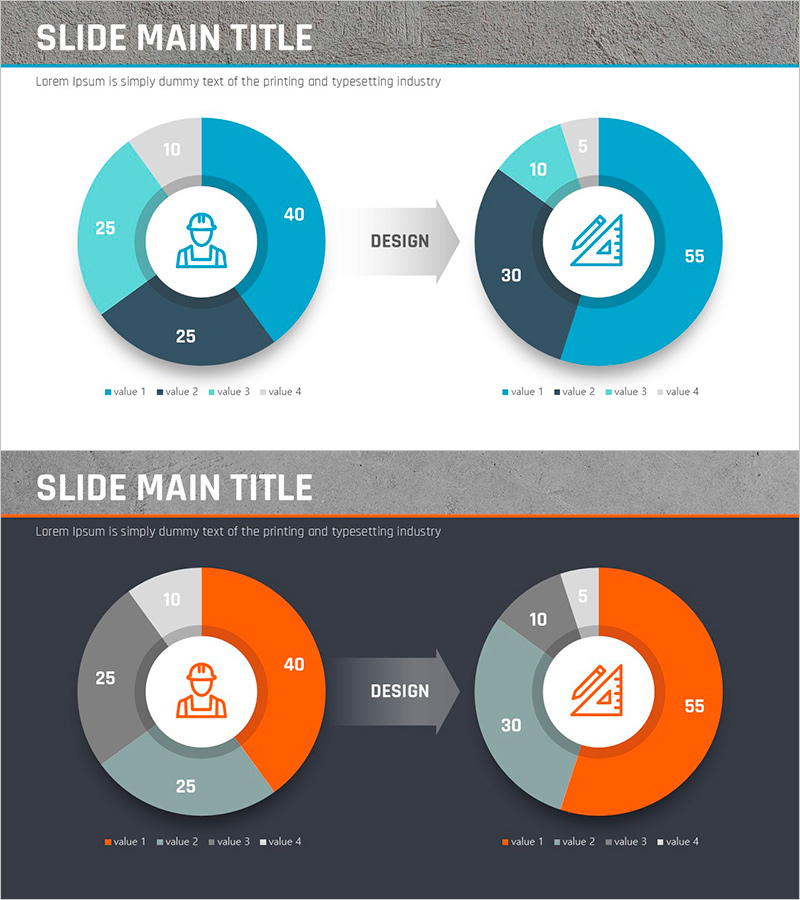
A 4-segment donut chart PowerPoint slide that visualizes technology flow and market share distribution. Presented in dual-tone blue and orange backgrounds with central icons (technician and construction tool), this slide expresses four data series through circular chart visualization. Each slide offers design variations to present the same data from multiple perspectives, making it immediately applicable to competitive analysis, operational status, and technology capability comparison. The 16:9 widescreen format with 2-slide composition is optimized for insertion into presentations, reports, and strategic planning documents.
Usage Points
-
Main Usage
Visualizes four data series—technology capability, market share, competitive positioning, and operational metrics—through circular chart format to maximize presentation impact. Central icons clarify the topic while proportional segments intuitively communicate each data series.
-
How to Use
Use in business strategy, technology planning, and marketing analysis presentations to explain competitive landscape, technology distribution, and market composition. The 2-slide set provides background color and icon variations to adapt to different presentation contexts.
-
Recommended For
Technology managers, strategy planning teams, marketing analysts, and executive audiences. Supports data-driven decision-making in business plans, quarterly reports, investor pitch decks, and product technology briefings.
-
Slide Structure
2-slide set. Each slide features a central circular icon surrounded by a 4-segment donut chart. Blue series (40, 25, 25, 10) and orange series (55, 30, 10, 5) in dual-tone color scheme. Legend included for clear segment identification.
Related Products
-

VR Education Template Share Chart
#Product/Service Introduction #Market and Competitor Analysis #Graph
-
![Analysis of [3 Key Factors] with Donut Chart - Market Status and Share](https://image.goodpello.com/2025/08/16/9c5d48b8-118b-499e-a39c-4b78a2acdc1e.jpg?w=300&h=336&format=auto)
Analysis of [3 Key Factors] with Donut Chart - Market Status and Share
#Market and Competitor Analysis #Graph #Market Status
-

Sharing vs Housing Insights Chart – Market Share and Competitive Advantage
#Market and Competitor Analysis #Graph #Market Share
-

Marking Milestones with Market Data – Market Status and Share
#Market and Competitor Analysis #Graph #Market Status
