Segmentation Graphs and Analysis Charts – Optimized for Market and Competitor Analysis
RJ0900014_11
- Last Update 08/19/2025
- File Size 3MB
- # of Slides 2
- File Format PPTX
- Slide Ratio 16:9
- Color
Keywords
- #Content-Based Slides
- #Design-Based Slides
- #Operational Plan
- #Market and Competitor Analysis
- #Graph
- #Other
- #Capital Investment Plan
- #Market Analysis
- #Horizontal Bar
- #Segmented Horizontal Bar
- #16:9
- #segmentation chart PowerPoint
- #analysis graph slide
- #market analysis presentation
- #competitor analysis PPT
- #comparison chart template
- #data visualization slide
About the Product
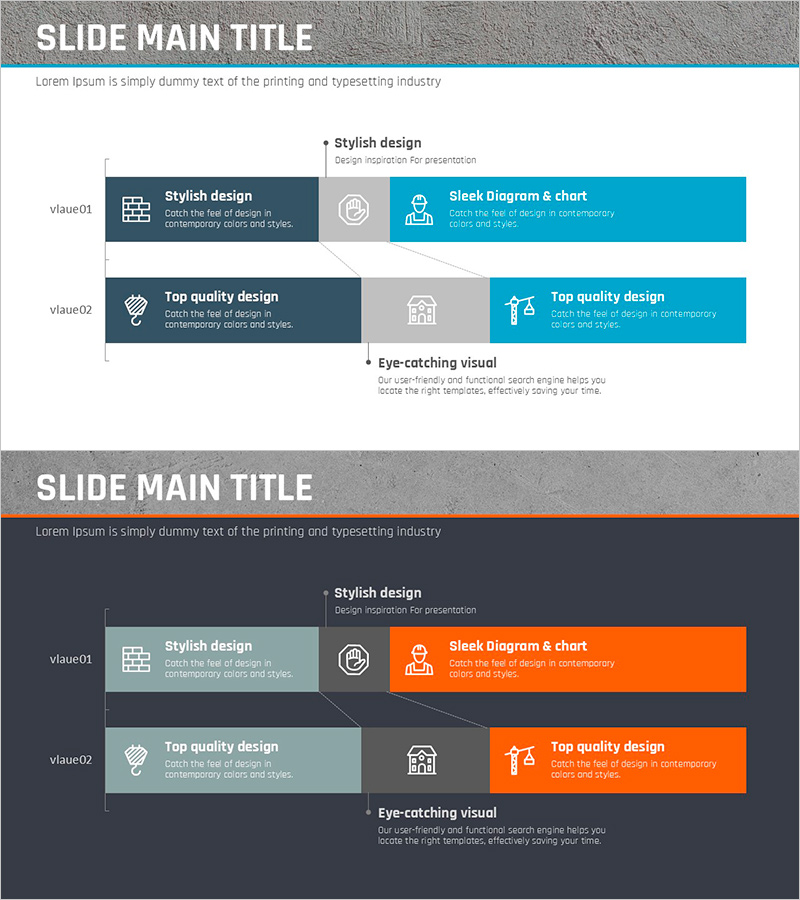
A PowerPoint slide deck featuring segmentation graphs and analysis charts designed for market and competitor analysis. The 2-slide set uses a dark blue, gray, and cyan color palette with a two-column layout: left-side icon boxes paired with right-side data areas. Each slide displays two analysis items side-by-side, enabling intuitive comparative analysis across competitors. This presentation slide is ready to use for explaining market segmentation, customer classification, and competitive positioning in business plans, marketing strategies, and investor pitches.
Usage Points
-
Main Usage
Designed to visually represent market segmentation, customer classification, and competitive positioning analysis. The left icon boxes hold analysis item names while the right data areas accommodate metrics and descriptions, clearly communicating competitive relationships.
-
How to Use
Insert into the market analysis section of business plans, marketing proposals, or investor pitch decks. Fill each slide's two item boxes with competitor names, product names, or segmentation criteria, then populate the cyan right-side areas with key characteristics, strengths, and weaknesses to complete the comparative analysis.
-
Recommended For
Marketing managers, strategy planning teams, and executives presenting competitive analysis findings. Ideal for new business entry assessments, product positioning, and market opportunity analysis where data-driven decision-making requires clear visual comparison.
-
Slide Structure
2-slide set. Each slide features a two-column layout: left side contains two dark blue and gray boxes (icon + text input areas), right side contains two cyan boxes (data description areas). Optimized for 16:9 widescreen format.
Related Products
-

Target Country Analysis Chart – Data Visualization for Market Analysis
#Market and Competitor Analysis #Graph #Other
-

Camera Shooting App Analysis Graph – Visualization and Insights
#Product/Service Introduction #Market and Competitor Analysis #Graph
-

Asia Target Market Analysis Graph – Tremendous Visual Appeal
#Market and Competitor Analysis #Graph #Other
-

Regional Analysis Graphs – Visualizing Market Trends
#Market and Competitor Analysis #Graph #Other
