Real Estate Timeline – Visualizing History and Operational Plans
RJ0900012_6
- Last Update 08/19/2025
- File Size 0.1MB
- # of Slides 2
- File Format PPTX
- Slide Ratio 16:9
- Color
Keywords
- #Content-Based Slides
- #Design-Based Slides
- #Company Introduction
- #Operational Plan
- #Diagram
- #Text Box
- #History
- #Capital Investment Plan
- #Cluster
- #Chain Diagram
- #Speech Bubble
- #16:9
- #timeline diagram PowerPoint
- #circular timeline slide template
- #real estate company profile
- #history visualization PPT
- #4-stage process diagram
About the Product
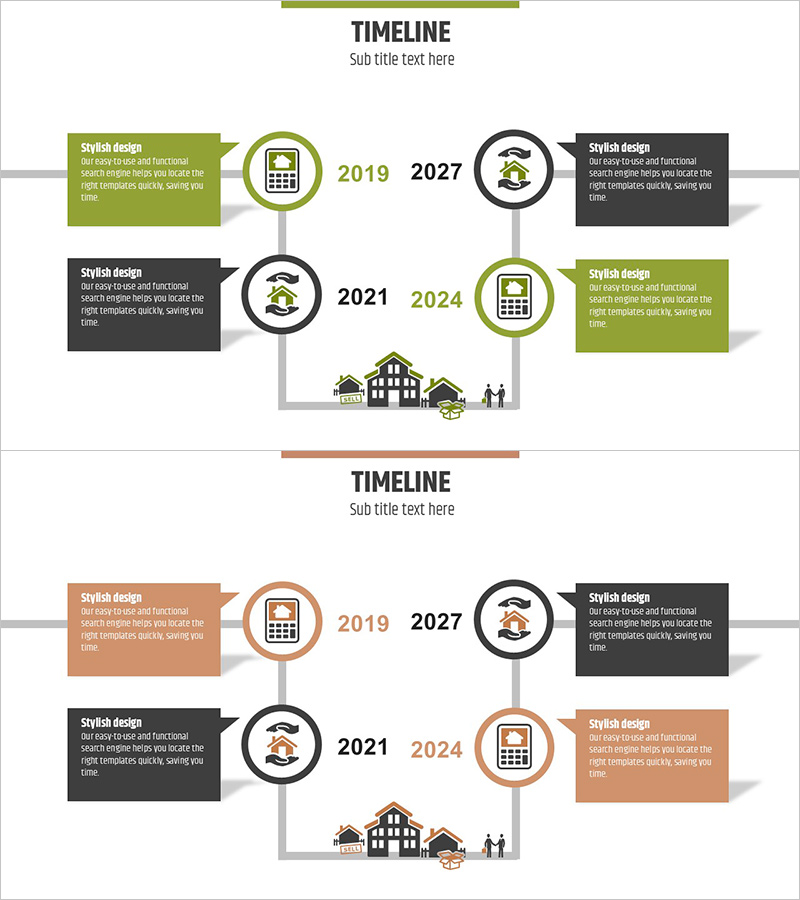
A PowerPoint slide template visualizing real estate company history and operational plans through a 4-stage circular timeline diagram. The 2-slide set features a dual-tone color scheme of green and charcoal with circular nodes and a central building icon to intuitively convey temporal progression. Each stage includes text boxes and icons highlighting key milestones, optimized for 16:9 widescreen format. Ideal for corporate presentations, company profile decks, and business reports to effectively communicate organizational growth and future vision.
Usage Points
-
Main Usage
Presents a real estate company's key milestones from founding to present and future plans through a 4-stage circular structure, clearly communicating organizational growth trajectory and vision. The central building icon and circular node arrangement naturally express the flow of time.
-
How to Use
Apply to company introduction presentations, investor briefings, and business reports when explaining corporate history and future strategy. Customize node text and icons for various industries, and adjust colors to match brand identity. Suitable for multiple presentation contexts requiring timeline visualization.
-
Recommended For
Recommended for real estate and construction company executives, marketing teams, and sales professionals presenting company history and vision. Valuable for investor relations materials, new employee onboarding presentations, and corporate introduction decks where visual storytelling of organizational growth is essential.
-
Slide Structure
2-slide set with the first slide featuring a green-toned 4-stage circular diagram and the second in warm brown tones. Each slide centers on a building icon with 4 circular nodes arranged clockwise, each connected to year labels and descriptive text boxes for milestone information.
Related Products
-

History Speech Bubble Diagram - Visual Timeline Representation
#Company Introduction #Business Management #Diagram
-

Journey of Change by Year – Business Strategy Visualization
#Company Introduction #Business Strategy #Diagram
-

Text Box History Diagram Template – Company Introduction and Business Strategy
#Company Introduction #Business Strategy #Diagram
-

Business History Connection Diagram – Company Growth Story
#Company Introduction #Diagram #History
