Journey of Change by Year – Business Strategy Visualization
RB0800021_4
- Last Update 03/22/2025
- File Size 1MB
- # of Slides 2
- File Format PPTX
- Slide Ratio 4:3
- Color
Keywords
- #Content-Based Slides
- #Design-Based Slides
- #Company Introduction
- #Business Strategy
- #Diagram
- #Text Box
- #History
- #Cluster
- #Chain Diagram
- #Speech Bubble
- #Project Progress
- #4:3
- #timeline diagram PowerPoint
- #year-by-year change visualization slides
- #business progress timeline template
- #speech bubble diagram presentation
- #how to create timeline in PowerPoint
About the Product
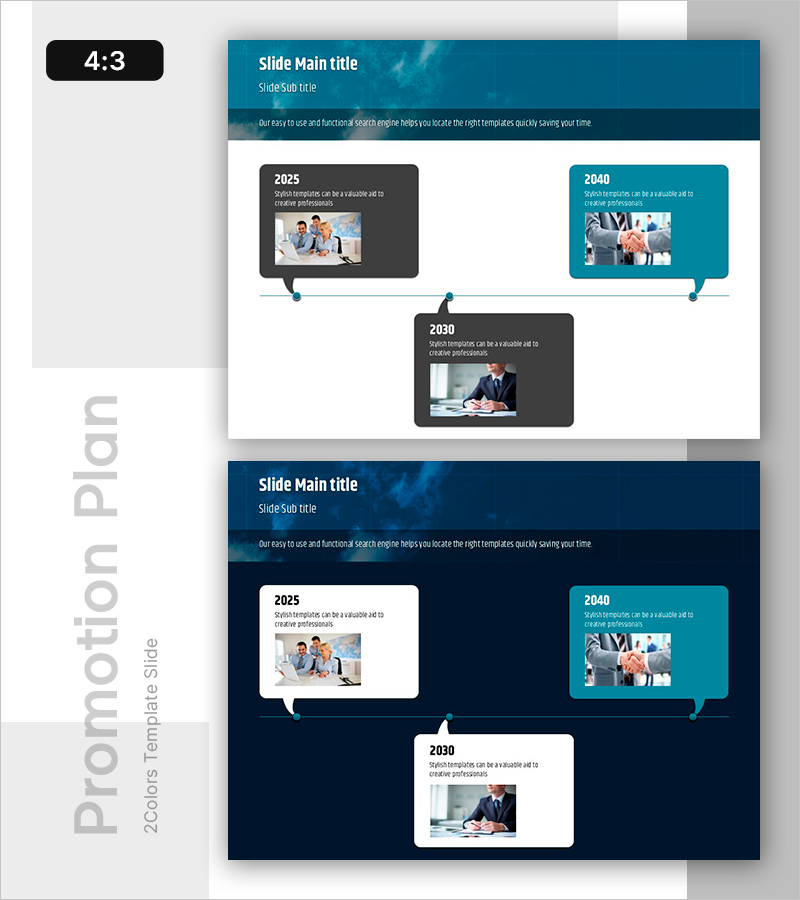
A timeline diagram PowerPoint slide that visualizes business progress across multiple years. This presentation template features three time-point nodes (2025, 2030, 2040) in speech bubble format, using a dark gray and turquoise two-tone color scheme for visual contrast. Each node accommodates both images and text, enabling simultaneous communication of change processes, achievements, and future vision. The 4:3 aspect ratio with 2-slide layout is ready for immediate use in business reports, strategy presentations, and progress documentation.
Usage Points
-
Main Usage
Visualizes business strategy evolution, achievements, and objectives across time periods. Designed to display annual milestones, project status, and vision realization in a single view. Ideal for executive briefings, investor presentations, and strategic planning communications.
-
How to Use
Edit text and image areas in each node (2025, 2030, 2040) to input actual business data. Speech bubble background colors, text size, and fonts are fully customizable. Adding nodes or modifying connector lines is straightforward. The 4:3 ratio ensures compatibility with existing presentation materials.
-
Recommended For
Business planning teams, strategy departments, executive reporting staff, project managers, and marketing planners explaining business roadmaps, growth strategies, and organizational changes. Particularly effective for presenting medium-term plans, annual goals, and long-term vision aligned on a timeline.
-
Slide Structure
2-slide layout. Header section (dark blue background with white typography) and content area (white background). Three speech bubble nodes horizontally arranged (left dark gray, center dark gray, right turquoise) with image area (~120×80px) and text input zones (title and description) in each node. Dotted connector lines with circular anchors indicate flow between nodes.
Related Products
-

Timeline Slide Visualizing Current Security Posture
#Company Introduction #Business Strategy #Diagram
-

Adventure Company History 4 Color Connection Diagram
#Company Introduction #Business Strategy #Diagram
-

Timeline of Health Routine Evolution – Visualizing Business Strategies
#Company Introduction #Business Strategy #Diagram
-

History Speech Bubble Diagram - Visual Timeline Representation
#Company Introduction #Business Management #Diagram
