Real Estate Contract Trend Analysis Chart – Visual Data for Business Success
RJ0900012_26
- Last Update 08/19/2025
- File Size 0.2MB
- # of Slides 2
- File Format PPTX
- Slide Ratio 16:9
- Color
Keywords
- #Content-Based Slides
- #Design-Based Slides
- #Business Introduction
- #Business Strategy
- #Diagram
- #Graph
- #Other
- #Achievements
- #Table
- #16:9
- #real estate chart PowerPoint slide
- #contract trend analysis presentation
- #stacked bar graph slide
- #real estate data visualization PPT
- #market analysis chart template
About the Product
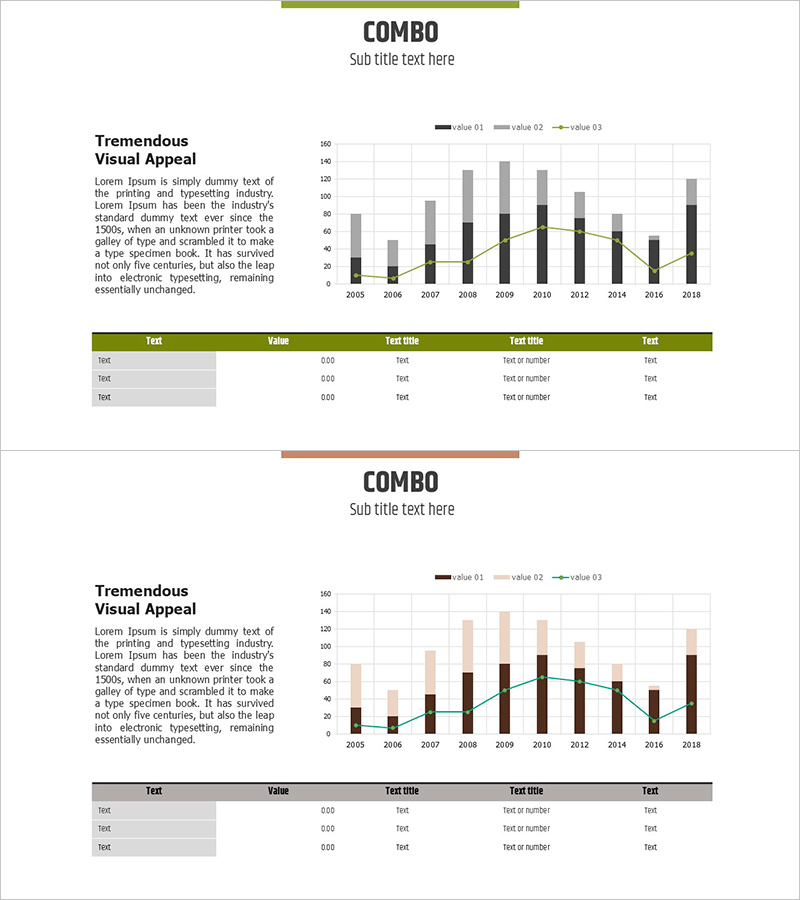
A 2-slide PowerPoint presentation designed for real estate market analysis. The layout combines stacked bar charts with line graphs to visualize contract trends across multiple dimensions. The left section provides space for analytical text and insights, while the right section displays data spanning 2005–2018. A green header bar and gray-beige color palette convey professionalism and data credibility. The bottom section includes a structured data table for numerical reference. This slide deck is ready to integrate into real estate investment reports, market analysis presentations, and business plan documents.
Usage Points
-
Main Usage
This slide visualizes real estate market contract trends using time-series data. The stacked bar graph enables comparison of multiple contract types simultaneously, while the line chart emphasizes overall market direction. Ideal for communicating market conditions to investors, tenants, and policy makers with data-driven credibility.
-
How to Use
Deploy in real estate investment reports (market analysis section), business plans (market overview page), or real estate brokerage presentations. Replace placeholder data with actual figures and customize the left-side text with your analysis. Both slides share identical layouts, allowing flexible adaptation to different datasets.
-
Recommended For
Real estate developers and investment firms presenting to executives, financial institutions explaining real estate fund performance, government agencies announcing property policy, and real estate consulting firms preparing client proposals. Suitable for any organization requiring data-backed decision-making in the property sector.
-
Slide Structure
Each slide features a left text area (title and analysis content space) paired with a right chart area (stacked bar graph plus line chart overlay). A 5-column data table at the bottom organizes numerical information. Both slides maintain consistent layout for cohesive multi-slide data storytelling.
Related Products
-

Onion Ingredients and Analysis Charts - Data Visualization in Food Industry
#Product/Service Introduction #Business Strategy #Diagram
-

Idea Development Analysis Chart – Data-Driven Innovation
#Product/Service Introduction #Business Introduction #Diagram
-

Revenue Growth Analysis Graph & Table - Financial Condition and Data Visualization
#Business Introduction #Diagram #Graph
-

Construction Company Debt and Capital Structure Analysis Chart
#Business Introduction #Market and Competitor Analysis #Diagram
