Doughnut Chart Slide for Analyzing Technology Data
RJ0500048_14
- Last Update 06/20/2025
- File Size 0.4MB
- # of Slides 2
- File Format PPTX
- Slide Ratio 16:9
- Color
Keywords
About the Product
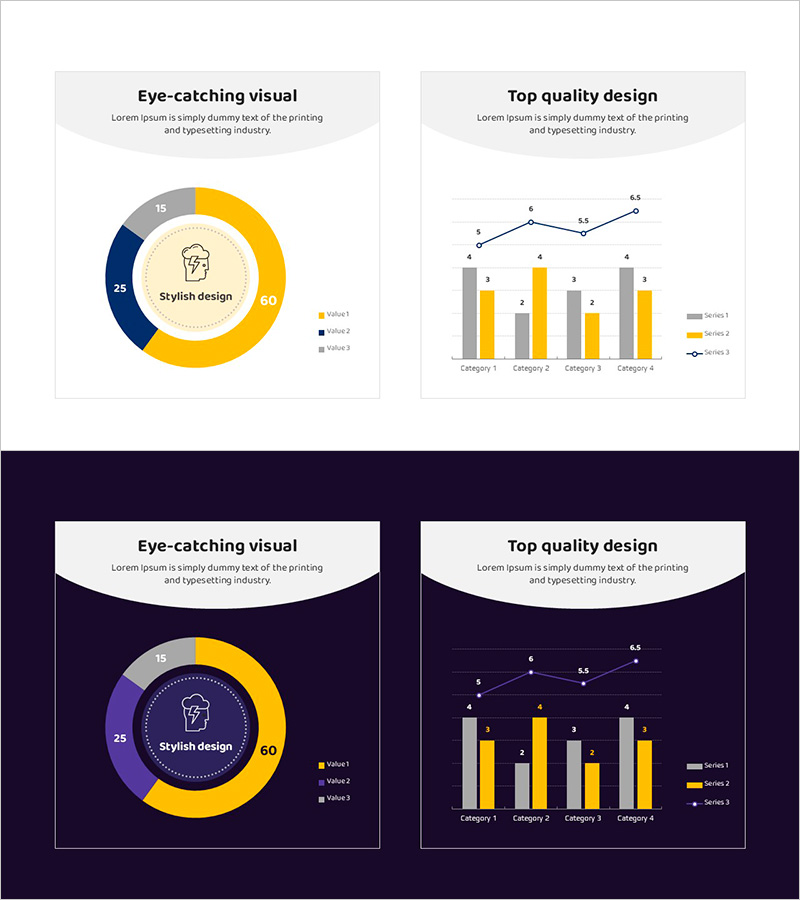
A professional doughnut chart PowerPoint slide designed for technology data analysis and reporting. The slide features a central circular area for key messaging, with an outer doughnut ring divided into three data segments (blue, yellow, gray) to represent proportional data intuitively. The accompanying combination chart slide includes a grouped bar graph and line trend overlay across four categories, ideal for comparative analysis. Delivered in 16:9 widescreen format with 2 slides total, ready for immediate use in technical reports, business strategy presentations, and performance analysis briefings.
Usage Points
-
Main Usage
Optimized for visualizing both compositional ratios and category-level trends in technical data. The doughnut center emphasizes key metrics or messages, while the three outer segments represent detailed data points, creating clear information hierarchy.
-
How to Use
Apply to technical report data sections, business strategy presentations showing performance metrics, and product specification comparison materials. Replace doughnut values and legend with your own data, then input core messaging in the center text area.
-
Recommended For
Technology managers, data analysts, project leads, and business planning teams explaining technical performance metrics, system composition ratios, and resource allocation. Ideal for IT companies, manufacturing firms, and R&D departments conducting regular reporting and strategic planning sessions.
-
Slide Structure
Slide 1: Central circular area with icon and 3-segment doughnut ring (blue 25%, yellow 60%, gray 15%) for proportional display. Slide 2: Four-category grouped bar chart with three data series and overlaid line trend graph positioned vertically for comparative analysis.
Related Products
-

Analysis of Social Media Cloud Development Status – Stylish Donut Chart
#Product/Service Introduction #Business Introduction #Graph
-

Comparison Bar Graphs and Core Doughnut Charts – Performance Analysis
#Business Introduction #Business Strategy #Graph
-

Technology Achievement Donut Chart
#Product/Service Introduction #Business Introduction #Graph
-

Donut Chart and Mobile Mockup – Market Share Analysis
#Business Strategy #Market and Competitor Analysis #Graph
