Real Estate Sales Table – Financial Performance Visualization
RJ0900012_24
- Last Update 08/19/2025
- File Size 0.1MB
- # of Slides 2
- File Format PPTX
- Slide Ratio 16:9
- Color
Keywords
- #Content-Based Slides
- #Design-Based Slides
- #Financial Plans and Performance
- #Diagram
- #Income Statement
- #Key Financial Indicators
- #Table
- #16:9
- #financial data table PowerPoint slide
- #data table presentation template
- #sales performance table
- #income statement slide
- #how to create financial data visualization in PowerPoint
About the Product
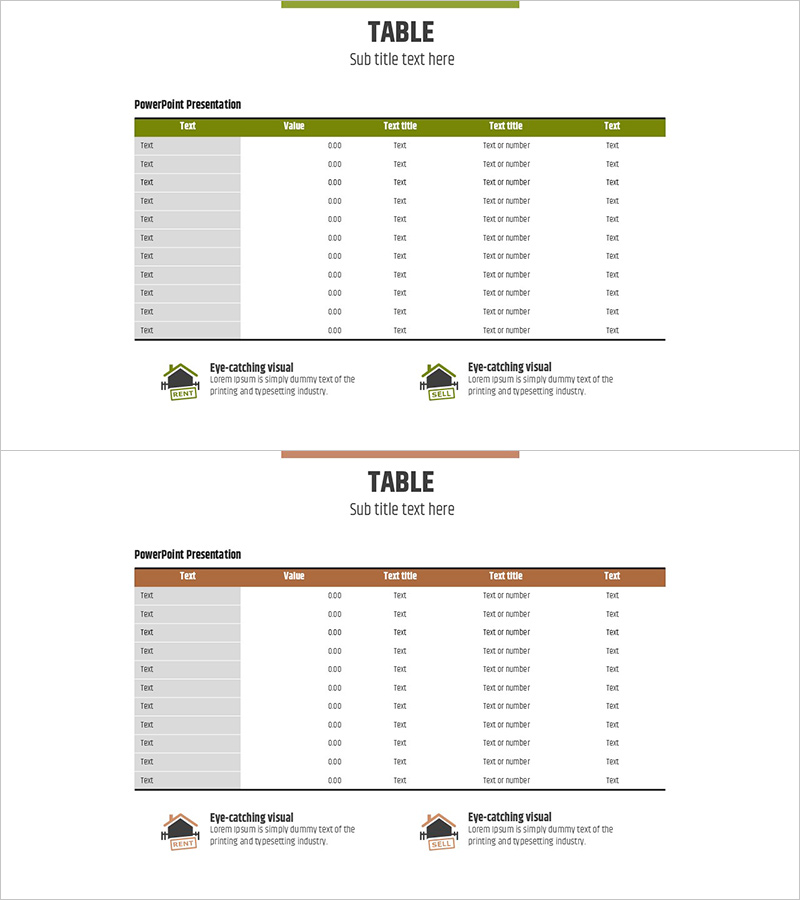
A data table PowerPoint slide optimized for real estate and financial presentations. Featuring a green header with light gray rows, this 2-layout design clearly visualizes sales figures, profit and loss statements, and budget data. The 5-column structure accommodates item names, values, percentages, and descriptions in a systematic arrangement. Fully editable text fields and cell structures enable immediate data input. Ideal for investor presentations, financial reports, and performance analysis materials.
Usage Points
-
Main Usage
Communicate numerical financial information—such as real estate sales, financial performance, and budget status—in clear table format. The green header and light gray row structure enhance data readability and strengthen financial credibility in presentations to investors, executives, and stakeholders.
-
How to Use
Enter item names (e.g., quarter, region, product) and numerical values (sales revenue, profit/loss, growth rate) into the slide's text cells. Use the 5-column layout to list data requiring comparative analysis, and emphasize key figures through color highlighting or font size adjustment.
-
Recommended For
Finance managers, IR specialists, real estate company executives, investment pitch presenters, and quarterly or annual performance report owners. Suitable for profit and loss statements, financial analysis, sales status, and budget planning sections.
-
Slide Structure
Two layout options provided: (1) Green header with light gray row table (5 columns × 11 rows), (2) Brown header with light gray row table (5 columns × 11 rows). Each cell accepts text input; header rows display item names while data rows contain figures and descriptions.
Related Products
-

Robot Business Revenue and Sales Analysis Table – A Systematic Approach to Financial Planning
#Financial Plans and Performance #Diagram #Income Statement
-

Income Statement Table Slide – Clear Financial Analysis
#Financial Plans and Performance #Diagram #Income Statement
-

Income Statement Table - Clear and Professional Data
#Financial Plans and Performance #Diagram #Income Statement
-

Sea Lighthouse Key Financial Indicators Table
#Financial Plans and Performance #Diagram #Income Statement
