Robot Business Revenue and Sales Analysis Table – A Systematic Approach to Financial Planning
RJ0400072_26
- Last Update 06/07/2025
- File Size 0.2MB
- # of Slides 2
- File Format PPTX
- Slide Ratio 16:9
- Color
Keywords
- #Content-Based Slides
- #Design-Based Slides
- #Financial Plans and Performance
- #Diagram
- #Income Statement
- #Key Financial Indicators
- #Table
- #16:9
- #financial data table PowerPoint slide
- #revenue analysis table template
- #sales comparison PPT
- #financial data visualization slide
- #how to create a financial table in PowerPoint
About the Product
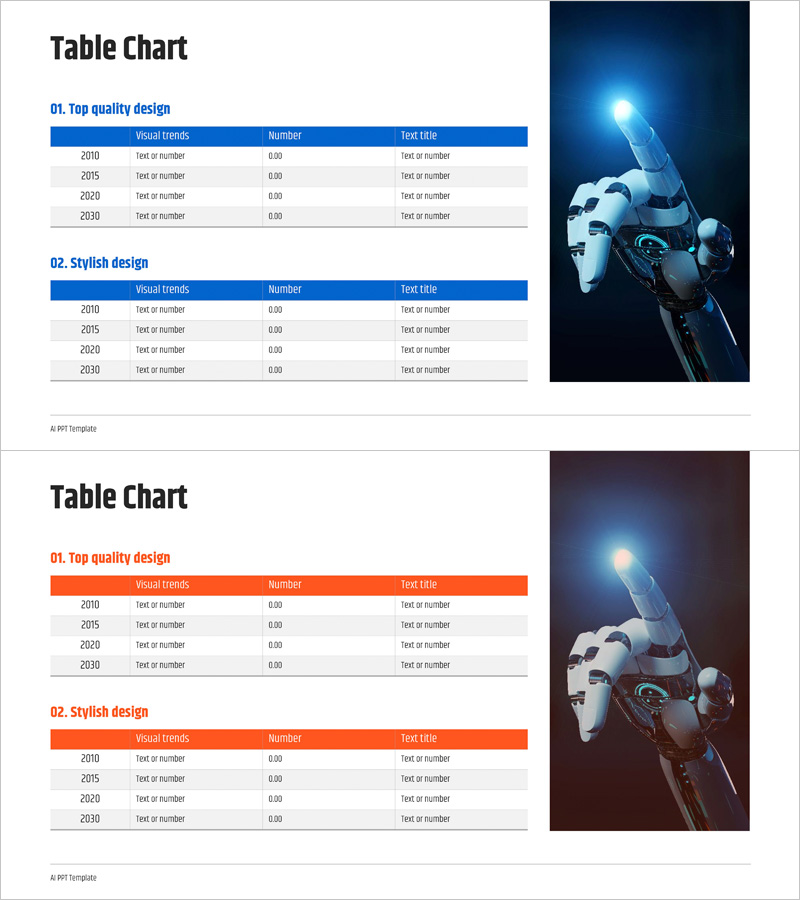
A financial data table PowerPoint slide designed for business revenue and sales analysis presentations. This slide deck features two design variations with blue and orange headers, each providing a three-column structure to display visual trends, numerical data, and text descriptions by year. Ideal for investor reports, business plans, and quarterly performance analysis in robotics, technology services, and IT projects. The table includes four data rows optimized for year-over-year, quarterly, or category-based financial comparisons. Fully editable and ready to customize with your company's revenue figures and performance metrics.
Usage Points
-
Main Usage
Present business revenue and sales performance data in a structured, year-over-year or quarterly comparison format. This slide enables investors, executives, and stakeholders to quickly understand financial metrics and performance trends through organized tabular visualization.
-
How to Use
Enter visual trend indicators (graphs or icons) in the first column, quantitative data (revenue, profit margins) in the second column, and performance interpretation or key insights in the third column. Select the blue header for emphasizing stability and trust, or the orange header to highlight growth and activity.
-
Recommended For
CFOs, finance teams, and IR departments presenting investor relations materials, quarterly earnings reports, and business plans. Particularly effective for technology, robotics, and B2B service companies seeking to strengthen financial credibility and data-driven storytelling.
-
Slide Structure
Two-slide set: Slide 1 features a blue header with three columns (visual trends, numerical data, text description) and four data rows; Slide 2 mirrors the same structure with an orange header. All cells support text, images, and charts; row heights and column widths are fully adjustable.
Related Products
-

Sea Lighthouse Key Financial Indicators Table
#Financial Plans and Performance #Diagram #Income Statement
-

Income Statement Table - Clear and Professional Data
#Financial Plans and Performance #Diagram #Income Statement
-

Fire Department Work Table – Visualizing Financial Plans and Performance
#Financial Plans and Performance #Diagram #Income Statement
-

Financial Performance Analysis Table Slide – Data Visualization for Growth
#Financial Plans and Performance #Diagram #Income Statement
