Green Brown Area Chart – Market and Competitor Analysis
RJ0900012_12
- Last Update 08/19/2025
- File Size 3.1MB
- # of Slides 2
- File Format PPTX
- Slide Ratio 16:9
- Color
Keywords
About the Product
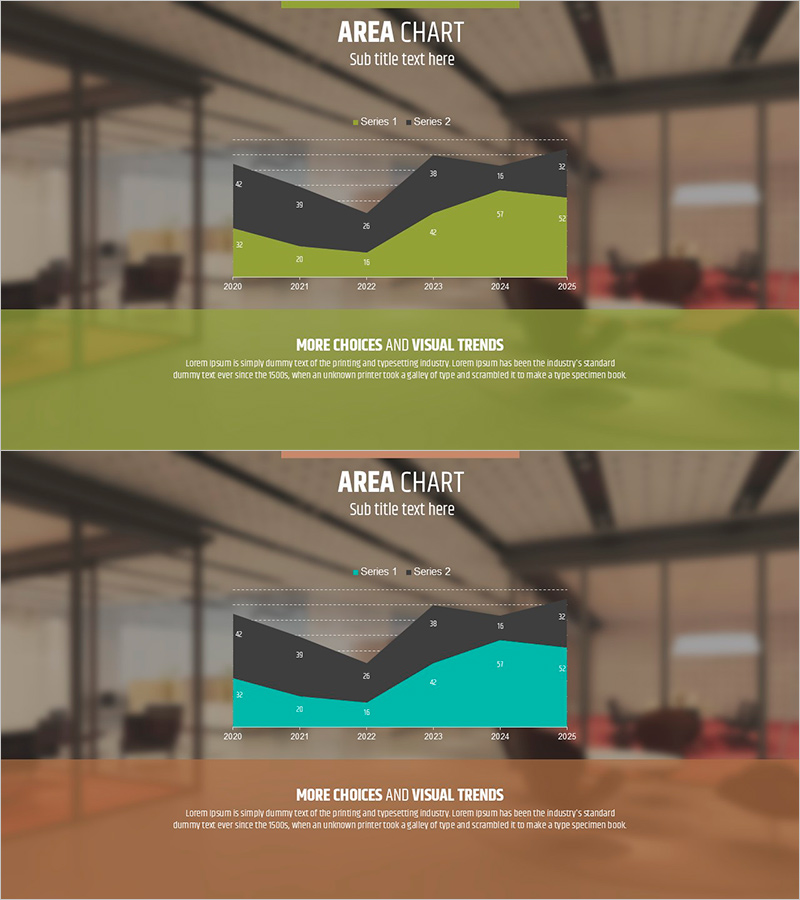
A dual-series area chart PowerPoint slide designed for market and competitor analysis presentations. The green and brown color scheme visualizes data trends from 2020 to 2025 with clear comparative insights. The legend at the top and horizontal gridlines enable easy numerical comparison, making it ready for immediate use in presentations and reports. Provided in 16:9 widescreen PPTX format with separate text input and chart areas for flexible editing and customization.
Usage Points
-
Main Usage
Ideal for expressing two-series time-series data such as market size changes, competitor market share comparisons, and revenue trend analysis. Designed with top legend and numerical indicators so audiences instantly grasp data meaning and comparative relationships.
-
How to Use
Use in business presentations, investor briefings, executive reports, and marketing strategy presentations to explain market conditions and competitive landscape. Add analysis topics in the slide title area and data sources at the bottom to enhance credibility and context.
-
Recommended For
Marketing managers, executives, business development teams, consultants, and investor relations professionals presenting market analysis findings. Particularly valuable during strategic planning phases requiring competitor comparison analysis and market positioning discussions.
-
Slide Structure
Top title area (AREA CHART text with subtitle input space), legend area (Series 1 and 2 indicators), main chart area (stacked dual-series area chart with 2020-2025 X-axis and numerical Y-axis), and bottom descriptive text area for source attribution and insights.
Related Products
-

Market Analysis Area Graph – Risk Reduction
#Market and Competitor Analysis #Graph #Other
-

Segmentation Graphs and Analysis Charts – Optimized for Market and Competitor Analysis
#Operational Plan #Market and Competitor Analysis #Graph
-

Illustration Glass Bottle Graph for Market Analysis – Competitive Edge
#Market and Competitor Analysis #Graph #Other
-

Progress Donut Chart – Visual Aid for Market Analysis
#Market and Competitor Analysis #Graph #Other
