Safety Template Free Horizontal Bar Graph
RJ0900011_22
- Last Update 08/19/2025
- File Size 0.1MB
- # of Slides 2
- File Format PPTX
- Slide Ratio 16:9
- Color
Keywords
About the Product
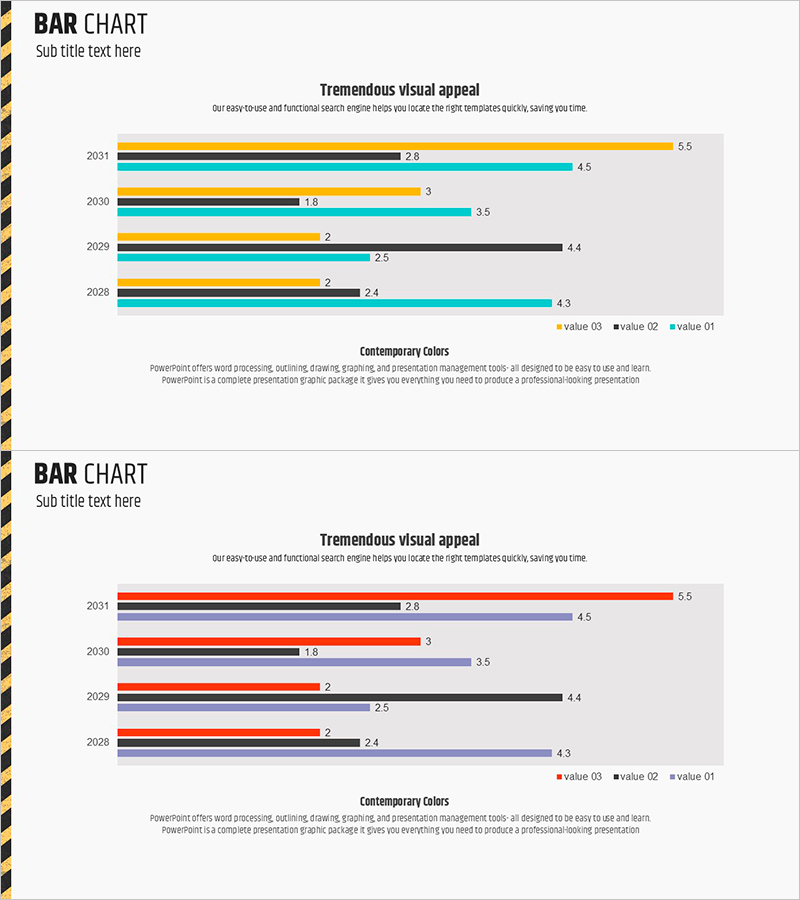
A horizontal bar chart PowerPoint slide that clearly visualizes year-over-year data changes across multiple series. Spanning 2028 to 2031, this slide displays three data series side by side for each year, enabling simultaneous comparison of trends over time and across categories. Color-coded in orange, teal, and black to distinguish each series, with numeric labels positioned at the bar ends for precise value identification. Ready to use in business reports, performance analysis presentations, and market research briefings.
Usage Points
-
Main Usage
Compares multi-series data over time, such as annual performance metrics, sales volumes, or market share trends. Bar length intuitively represents numeric magnitude, while color differentiation enables simultaneous tracking of multiple data series across years.
-
How to Use
Insert into report sections covering performance analysis, business results, or market research to explain year-over-year trends. Modify bar values and series labels to match your presentation content. Optimized for 16:9 widescreen display format.
-
Recommended For
Finance, marketing, and sales professionals presenting quarterly or annual performance to executives. Ideal for consulting firms' market analysis presentations, corporate business plan reviews, investor relations meetings, and data-driven decision-making sessions.
-
Slide Structure
Two-slide set with identical data structure but different color schemes. First slide uses orange, teal, and black series; second slide uses red, gray, and blue series. Each slide displays 4 years (2028–2031) with 3 data series arranged horizontally for easy comparison and analysis.
Related Products
-

Business Technology Status Bar Graph – Insights Delivered Through Data Visualization
#Product/Service Introduction #Business Introduction #Graph
-

Horizontal Bar Graph for Competitor Analysis – Effective Data Visualization
#Market and Competitor Analysis #Graph #Competitor Analysis
-

Market Demand Analysis PowerPoint Slide – Donut Chart Layout
#Market and Competitor Analysis #Graph #Customer Analysis
-

Current Status of Global Target Market Analysis – Strategic Insights through Data Visualization
#Company Introduction #Marketing Plan and Strategy #Graph
