Pill Shape Line Graph & Bar Graph – Essential for Market Analysis
RJ0400045_30
- Last Update 05/29/2025
- File Size 3MB
- # of Slides 2
- File Format PPTX
- Slide Ratio 16:9
- Color
Keywords
- #Content-Based Slides
- #Design-Based Slides
- #Market and Competitor Analysis
- #Graph
- #Text Box
- #Competitor Analysis
- #Column
- #Line
- #Grouped Column
- #Line Chart
- #Rounded Rectangle Text Box
- #16:9
- #line and column chart PowerPoint
- #combination chart slide template
- #dual-series data visualization
- #market analysis presentation
- #competitive analysis slide
- #multi-series chart template
About the Product
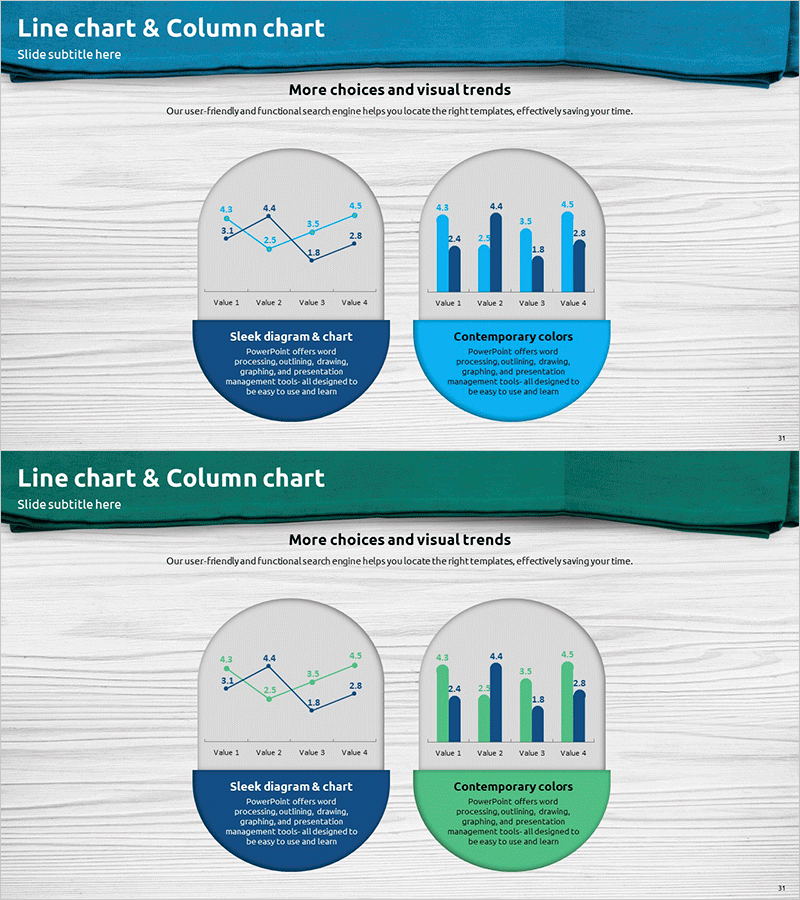
A 2-slide PowerPoint presentation combining line charts and column charts for simultaneous multi-data visualization. Ideal for market analysis, competitive benchmarking, sales trends, and quarterly performance reviews. Pill-shaped rounded text boxes emphasize key insights, while a teal header and white content area create clear visual hierarchy. Available in 16:9 widescreen PPTX format, fully editable and ready for immediate use in business presentations, financial reports, and strategic planning decks.
Usage Points
-
Main Usage
Display two or more data series simultaneously for market analysis, competitor comparison, sales performance trends, and quarterly results. The combination of line and column elements effectively communicates both trend direction and absolute values in a single visual.
-
How to Use
Double-click chart areas to input or replace data values. Edit rounded text box descriptions to clarify each chart's meaning. Adjust header colors and background shading to match your brand guidelines or presentation theme.
-
Recommended For
Marketing strategists, business analysts, financial planners, executives, and presentation specialists preparing quarterly reports, investor pitches, competitive analysis decks, and performance dashboards.
-
Slide Structure
2-slide layout. Slide 1: Teal header with title, centered line chart (4 data points), and rounded pill-shaped text box with description. Slide 2: Identical layout with column chart (4-item comparison) and rounded text box. Page numbers at bottom of each slide.
Related Products
-

Competitor Capability Analysis Chart – Efficient Market Analysis
#Market and Competitor Analysis #Graph #Competitor Analysis
-

Market Insights Through Competition Analysis Chart – Gaining Competitive Edge
#Market and Competitor Analysis #Graph #Competitor Analysis
-

Line Graph and Clustered Column Graph – Essential for Competitor Analysis
#Market and Competitor Analysis #Graph #Competitor Analysis
-

Analyzing 2 Comparison Graphs - Slides for Deriving Competitive Advantage
#Market and Competitor Analysis #Graph #Competitor Analysis
