Visual Slide for Consumer Demand Survey Results
RJ0600088_8
- Last Update 07/14/2025
- File Size 0.4MB
- # of Slides 2
- File Format PPTX
- Slide Ratio 16:9
- Color
Keywords
About the Product
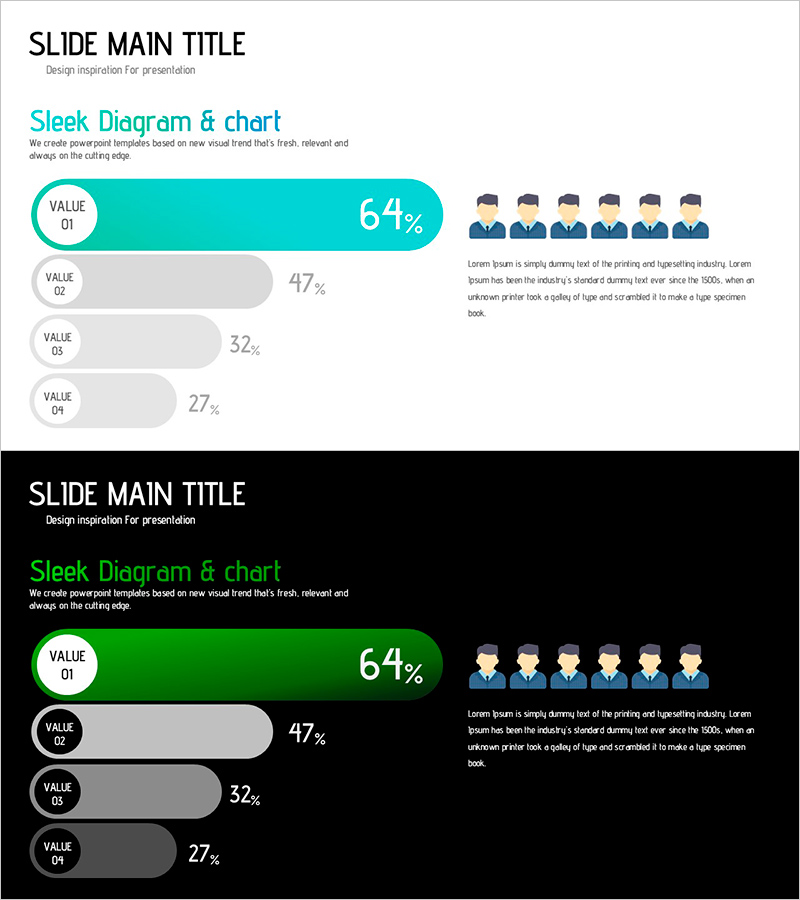
A professional PowerPoint slide set for visualizing market research and customer survey results with data-driven clarity. The design features a teal accent color contrasting against a light or dark background, with the highest value (64%) highlighted in a circular badge at the top. Four survey items are displayed as horizontal bar charts below, while six user icons on the right represent the surveyed population alongside descriptive text. This 2-slide presentation includes both light and dark background versions, allowing you to match your presentation environment and document style. Ideal for market analysis, customer insights, and competitive positioning sections in business proposals, investor pitches, and marketing plans.
Usage Points
-
Main Usage
Quantitatively visualize market research and customer analysis data to support strategic decision-making. Present consumer demand ratios, customer preferences, and market share comparisons with clarity. The teal accent color emphasizes key metrics and captures audience attention during presentations.
-
How to Use
Use this slide in business plans, investor pitch decks, and marketing strategy presentations when presenting market analysis and consumer survey findings. Select the light background version for printed documents and the dark background version for projector presentations. All text and numerical data are fully editable to match your specific research results.
-
Recommended For
Marketing managers, business planning teams, market research professionals, and executives presenting customer needs analysis. Ideal for new product launch planning, market entry strategy development, customer segmentation analysis, and data-driven decision-making presentations.
-
Slide Structure
Each slide contains a title area at the top, four horizontal bar charts with the highest value in a circular badge on the left-center, and six user icons with descriptive text on the right. Two layout versions (light and dark backgrounds) are provided for flexible use across different presentation contexts.
Related Products
-

User Analysis Donut Chart – Optimal for Market and Competitor Analysis
#Market and Competitor Analysis #Graph #Other
-

User Analysis Results Diagram - Infographic for Customer Insights
#Market and Competitor Analysis #Graph #Other
-

A Chart for the Total Population – Effective Market Analysis
#Market and Competitor Analysis #Diagram #Graph
-

Gender Ratio Analysis of Coffee Consumers - Consumption Patterns of Men and Women
#Market and Competitor Analysis #Graph #Other
