Trends in Heavy Equipment Utilization – Market Analysis
RJ0900011_16
- Last Update 08/19/2025
- File Size 0.2MB
- # of Slides 2
- File Format PPTX
- Slide Ratio 16:9
- Color
Keywords
About the Product
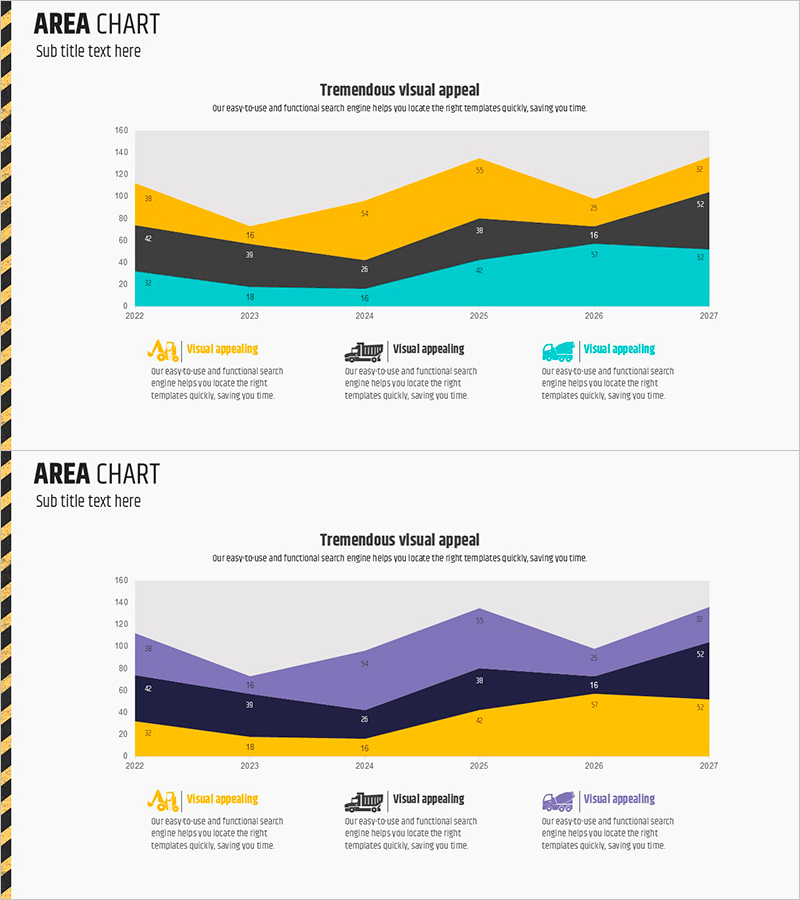
A professional stacked area chart PowerPoint slide designed for market analysis and trend visualization. This 2-slide template features dual color schemes: the first layout uses yellow, black, and cyan layers, while the second combines purple, black, and yellow. Both slides display time-series data from 2022 to 2027 with numerical labels embedded in each area segment for precise data communication. The 16:9 widescreen PPTX format is fully editable and ready for immediate use in business presentations, market reports, competitive analysis, and performance reviews.
Usage Points
-
Main Usage
Visualize multi-layer datasets across time periods to show market trends, competitive market share, and business performance evolution. The stacked area format simultaneously displays total volume changes and individual component contributions, making it ideal for executive presentations and strategic decision-making.
-
How to Use
Select one of the two provided layouts based on your data characteristics and color preference. Replace the numerical labels with your actual data values and update the legend text accordingly. Insert into business plans, investor pitch decks, or market analysis reports to strengthen data credibility and visual impact.
-
Recommended For
Marketing, sales, and planning teams presenting market analysis; finance teams reporting business performance; executive strategy meetings; investor and partner presentations. Particularly effective when emphasizing multi-layer trend comparisons and demonstrating data-driven insights.
-
Slide Structure
Both slides contain a title area, subtitle area, one stacked area chart, and 3-4 legend items. The first slide uses a yellow-black-cyan color scheme with 3 data layers, while the second employs purple-black-yellow. Numerical values are labeled within each area segment for clarity and precision.
Related Products
-

Comparison Graph of Major Shopping Areas – Market Trends Analysis
#Business Introduction #Market and Competitor Analysis #Graph
-

Three Area Comparison Graphs
#Business Introduction #Market and Competitor Analysis #Graph
-

Ship Logistics Equipment Status Analysis – Facility and Market Overview
#Business Introduction #Market and Competitor Analysis #Graph
-

Tablet PC Mockup Vertical Bar Graph – Market Analysis and Tech Insights
#Business Introduction #Market and Competitor Analysis #Graph
