Three Area Comparison Graphs
RJ0500036_11
- Last Update 06/16/2025
- File Size 0.5MB
- # of Slides 2
- File Format PPTX
- Slide Ratio 16:9
- Color
Keywords
- #Content-Based Slides
- #Design-Based Slides
- #Business Introduction
- #Market and Competitor Analysis
- #Graph
- #Other
- #Market Analysis
- #16:9
- #3-area comparison graph PowerPoint
- #stacked area chart slide
- #market analysis PowerPoint slide
- #data comparison chart PPT
- #how to create stacked area chart in PowerPoint
About the Product
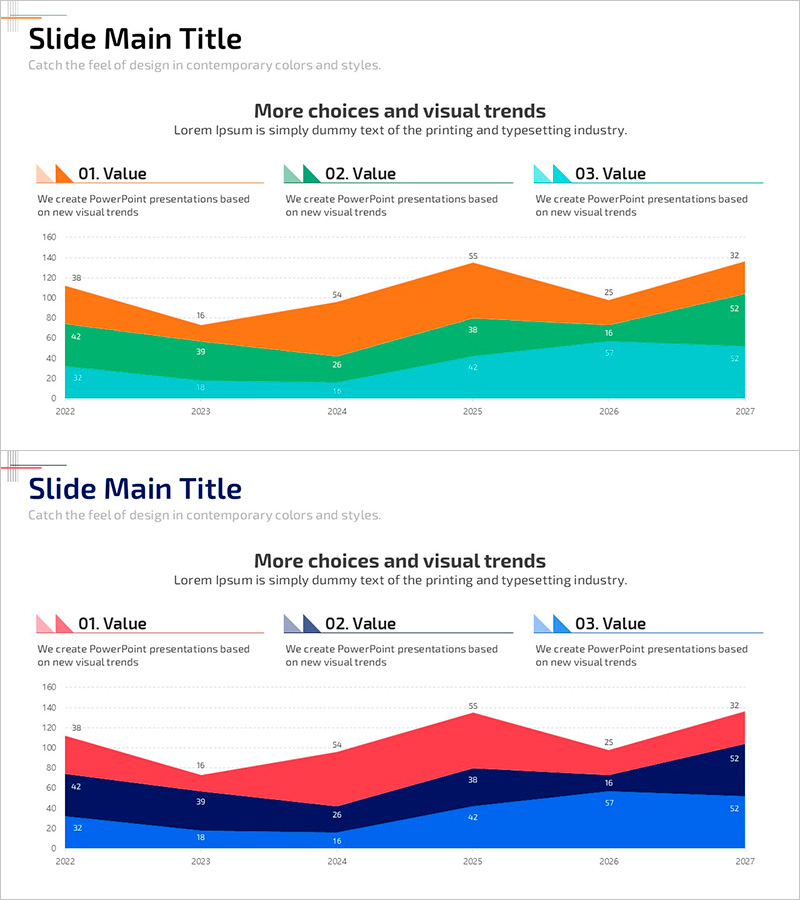
A professional stacked area chart PowerPoint slide optimized for market analysis and business presentations. The slide features three distinct data series visualized in orange, green, and cyan colors, displaying trends from 2022 to 2027 with clear numerical labels at each data point. The layout includes dedicated spaces for title, subtitle, and descriptive text, allowing for comprehensive data storytelling. With 2 slides in 16:9 widescreen format, you can present multiple market scenarios or comparative analyses seamlessly. Each area is clearly differentiated, making it ideal for investor pitches, executive reports, and market analysis documents where multi-series data comparison is essential.
Usage Points
-
Main Usage
Present multi-series data comparisons in market analysis, business performance reviews, and investor presentations. Stacked area charts simultaneously display absolute values and cumulative trends, making them ideal for market share evolution, revenue composition, and customer segment analysis.
-
How to Use
Enter your analysis topic in the title area (e.g., Market Share Trends, Customer Segment Changes) and specify the analysis period in the subtitle. Replace the chart legend and numerical labels with your actual data. The clear color differentiation ensures excellent readability in both print and digital presentations.
-
Recommended For
Executive and investor presentations, quarterly and annual business reports, market analysis reports, market overview sections in business plans, and revenue composition explanations in financial analysis. Particularly effective when comparing 3–5 data series simultaneously.
-
Slide Structure
Each slide features a title section (Slide Main Title) with subtitle area at the top, followed by a centered stacked area chart. Three legend items (01. Value, 02. Value, 03. Value) are positioned above the chart, with numerical labels displayed at each data point. Both slides maintain consistent layout for cohesive presentation flow.
Related Products
-

Tablet PC Mockup Vertical Bar Graph – Market Analysis and Tech Insights
#Business Introduction #Market and Competitor Analysis #Graph
-

Comparison Graph of Major Shopping Areas – Market Trends Analysis
#Business Introduction #Market and Competitor Analysis #Graph
-

Online Shopping Mall Composition Analysis Graph - Business Analysis and Technical Insights
#Business Introduction #Market and Competitor Analysis #Graph
-

Battery Shape Vertical Bar Graph – Market Status Analysis
#Business Introduction #Market and Competitor Analysis #Graph
