National Analytical Donut Chart – Market Share and Insights
RJ0900010_7
- Last Update 08/18/2025
- File Size 0.4MB
- # of Slides 2
- File Format PPTX
- Slide Ratio 16:9
- Color
Keywords
About the Product
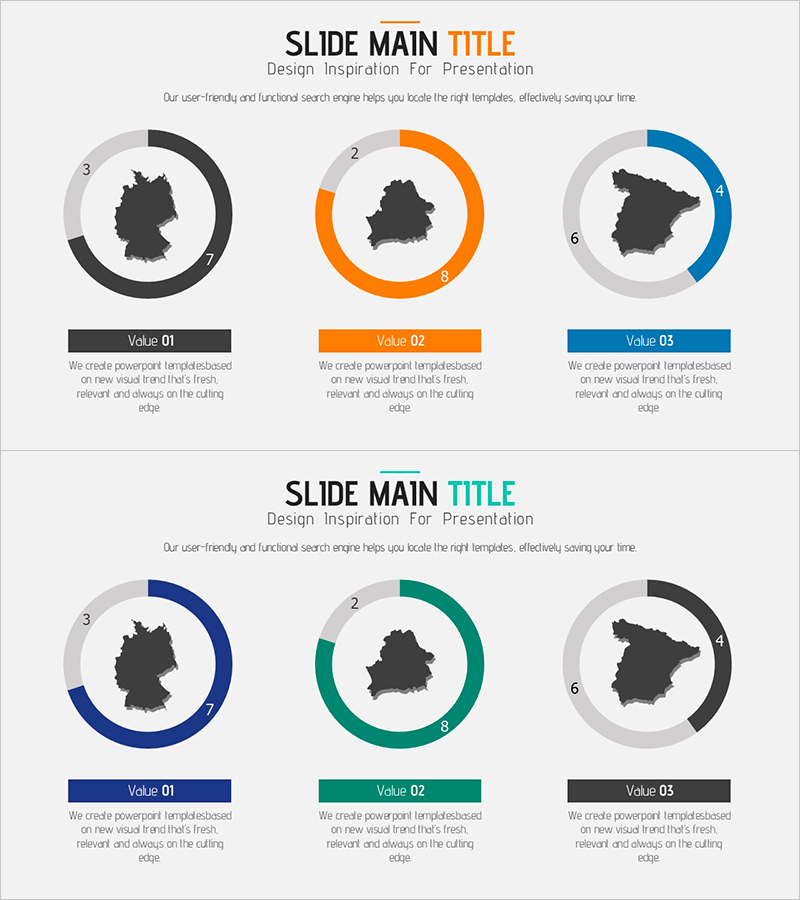
A PowerPoint slide featuring donut charts designed to visualize market share by country or region. Three donut charts in black, orange, blue, and green represent different data series, with country silhouettes in the center enabling intuitive regional comparison analysis. This 2-slide set is ready for immediate use in competitive analysis, market research, and business insight presentations.
Usage Points
-
Main Usage
Visualize proportional data such as regional market share, revenue distribution, and customer demographics using donut charts to clearly communicate market conditions and competitive positioning to executives, investors, and stakeholders.
-
How to Use
Input numerical data into each donut chart segment, then edit legends and titles to match your presentation context. Add country or region names to the map silhouettes to create regional comparison slides tailored to your analysis.
-
Recommended For
Business strategy planning, market analysis reports, competitive benchmarking, investor presentations, quarterly earnings reports, marketing strategy documents, and data-driven decision-making presentations requiring quantitative visualization.
-
Slide Structure
2-slide set with 3 donut charts (black, orange, blue, or green) arranged horizontally on each slide. Country or region silhouettes are positioned centrally, enabling at-a-glance regional data comparison and multi-series analysis.
Related Products
-

Target Market Map for the US Space Industry – Market Analysis Slide
#Market and Competitor Analysis #Graph #Other
-

Colors Theme Presentation Template - Map & Donut Chart
#Market and Competitor Analysis #Graph #Market Share
-

European Target Market Status Graph – Market Share Insights
#Market and Competitor Analysis #Graph #Other
-

Lighting Graph – Market Share and Target Analysis
#Market and Competitor Analysis #Graph #Other
