Horizontal Bar Graphs and Analysis – Market and Competitor Analysis
RJ0900010_14
- Last Update 08/18/2025
- File Size 0.4MB
- # of Slides 2
- File Format PPTX
- Slide Ratio 16:9
- Color
Keywords
- #Content-Based Slides
- #Design-Based Slides
- #Market and Competitor Analysis
- #Graph
- #Competitive Advantage
- #Horizontal Bar
- #Horizontal Bar Chart
- #16:9
- #horizontal bar chart PowerPoint
- #market analysis slide template
- #competitor analysis presentation
- #bar graph template download
- #data comparison PPT slide
About the Product
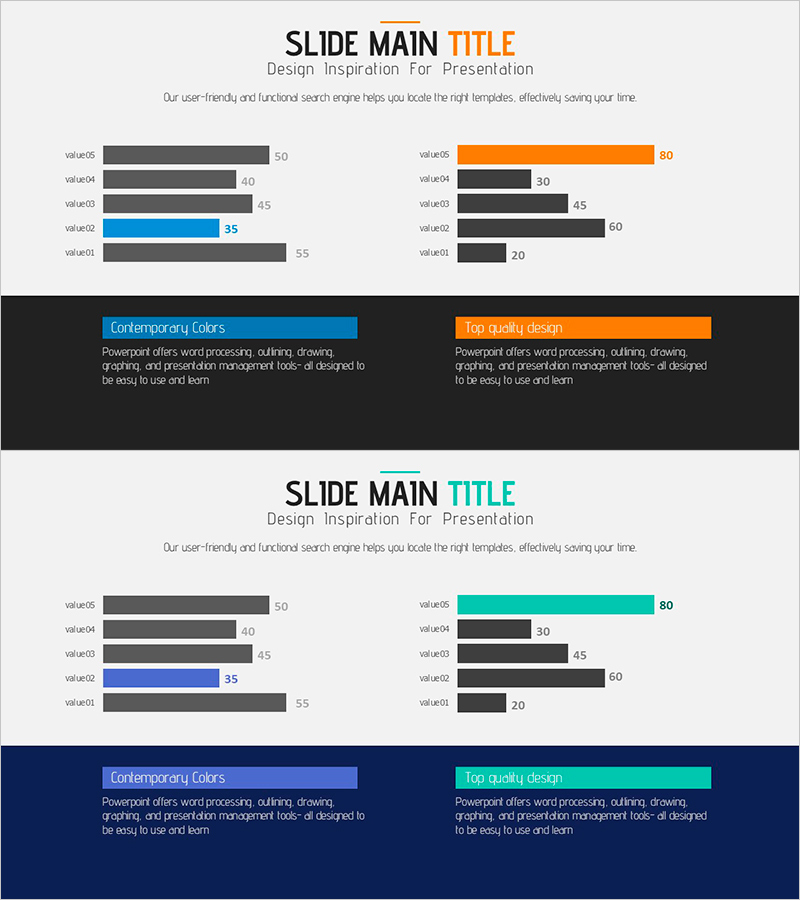
A horizontal bar chart PowerPoint slide optimized for market analysis and competitive comparison. The design uses orange and black dual-tone coloring to clearly emphasize data contrast, enabling side-by-side comparison of five data points. The left gray bars and right orange bars visualize two metrics simultaneously—such as company vs. competitors, current vs. target, or actual vs. forecast—making it ideal for competitive advantage analysis, market share comparison, and performance benchmarking. This presentation template effectively communicates quantitative data in business reports, pitch decks, and strategic planning documents.
Usage Points
-
Main Usage
Compares quantitative metrics such as market size, competitor performance, and company positioning using horizontal bars. Two data series (company vs. competitors, current vs. goal, actual vs. plan) are displayed side-by-side to illustrate relative advantage and performance gaps intuitively.
-
How to Use
Insert into business plans, quarterly performance reports, marketing strategy presentations, and investor pitch decks in the competitive landscape analysis section. Double-click each bar value to edit numbers and adjust colors to match corporate branding guidelines.
-
Recommended For
Executives, marketing managers, strategy planners, and sales leaders presenting competitive analysis, market conditions, and performance metrics. Suitable for decision-making meetings and external reporting where quantitative evidence is essential.
-
Slide Structure
Two-slide layout. First slide features five gray bars on the left (50, 40, 45, 35, 55) and five orange bars on the right (80, 30, 45, 60, 20) for direct comparison. Second slide includes teal and orange highlight boxes to summarize key insights and conclusions in text format.
Related Products
-

Horizontal Bar Chart for Market Analysis – Trends and Competitive Advantage
#Market and Competitor Analysis #Financial Plans and Performance #Graph
-

Performance Analysis of the Second-Ranked Item – Towards Successful Strategies
#Business Strategy #Market and Competitor Analysis #Graph
-

Bar Chart for Vegetable Intake Survey
#Market and Competitor Analysis #Graph #Market Analysis
-

Pencil Horizontal Chart Competitive Advantage - Visualizing Market Status
#Market and Competitor Analysis #Graph #Other
