Customer Analysis Visualization with Horizontal Bar Chart
RJ0800049_7
- Last Update 08/14/2025
- File Size 0.7MB
- # of Slides 2
- File Format PPTX
- Slide Ratio 16:9
- Color
Keywords
About the Product
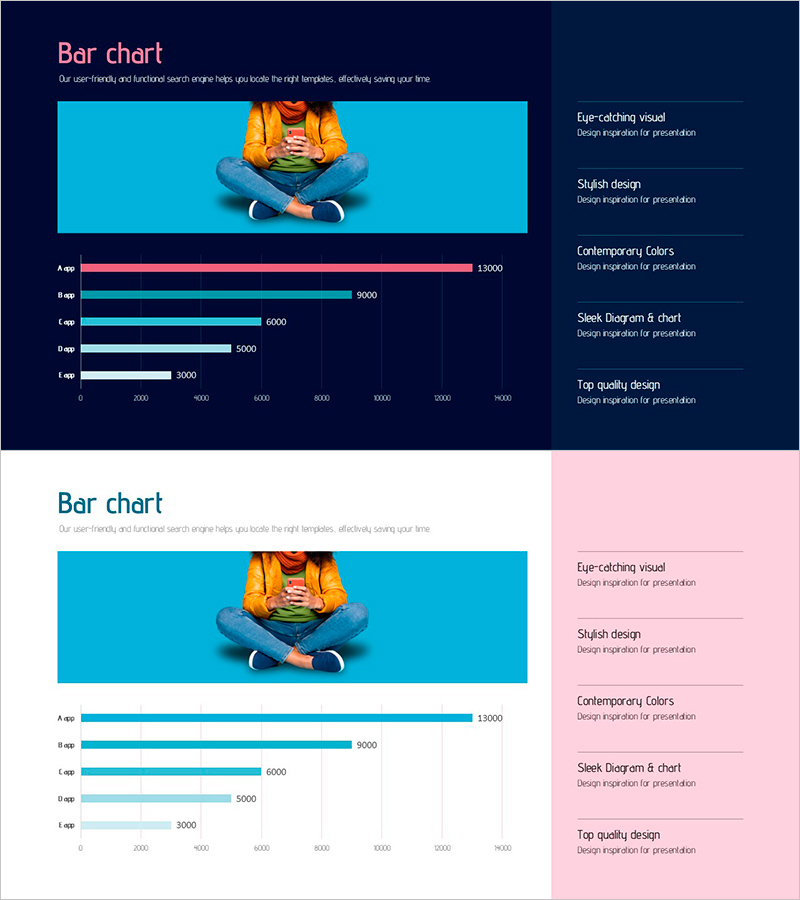
A horizontal bar chart PowerPoint slide optimized for customer analysis and market research presentations. Featuring five data items displayed in pink, cyan, and white tones against a dark navy background, with clear numerical labels for each bar. The 2-slide set includes an identical layout version with a light pink background, allowing you to choose the design that best matches your presentation tone. Ideal for customer segmentation, competitive benchmarking, market share analysis, and sales performance comparisons. All data values and colors are fully editable in PowerPoint.
Usage Points
-
Main Usage
Visualize and compare five data items such as customer segments, competitor metrics, market share, or sales figures in a horizontal bar format. Numerical labels are clearly displayed, making it suitable for data sections in business reports, proposals, and marketing presentations.
-
How to Use
Simply edit the bar lengths and numerical values to match your data. The dark navy version suits professional, premium-toned presentations, while the light pink version works well for casual, approachable documents. Colors and axis ranges are fully customizable.
-
Recommended For
Marketing teams presenting customer analysis reports, sales teams preparing market overview proposals, executive-level competitive analysis materials, and consulting projects requiring benchmarking slides. Recommended for any business presentation requiring quantitative comparisons.
-
Slide Structure
2-slide set with identical layouts in two background versions. Each slide contains a title area, five horizontal bars (labeled A–E), a numerical axis ranging from 0 to 13,000, and a text description area on the right side.
Related Products
-

Layout Design Presentation Template for Market & Competitor Analysis – Column Chart
#Market and Competitor Analysis #Graph #Customer Analysis
-

Horizontal Bar Chart for Customer Analysis – Highlighting Competitive Advantage
#Market and Competitor Analysis #Graph #Customer Analysis
-

Eco-friendly Icon Bar Graph – Effective Visualization for Market Analysis
#Business Strategy #Market and Competitor Analysis #Graph
-

Bar Chart Analysis of Cosmetics Trends – Boosting Competitiveness
#Market and Competitor Analysis #Financial Plans and Performance #Graph
