Construction Industry Future Forecast Graphs and Messages
RJ0900013_20
- Last Update 08/19/2025
- File Size 0.4MB
- # of Slides 2
- File Format PPTX
- Slide Ratio 16:9
- Color
Keywords
- #Content-Based Slides
- #Design-Based Slides
- #Business Strategy
- #Market and Competitor Analysis
- #Graph
- #Financial Outlook & Expected Impact
- #Future Outlook
- #Line
- #Line Chart
- #16:9
- #line chart PowerPoint
- #multi-series trend chart
- #time series data visualization
- #long-term forecast slide
- #comparative line graph template
About the Product
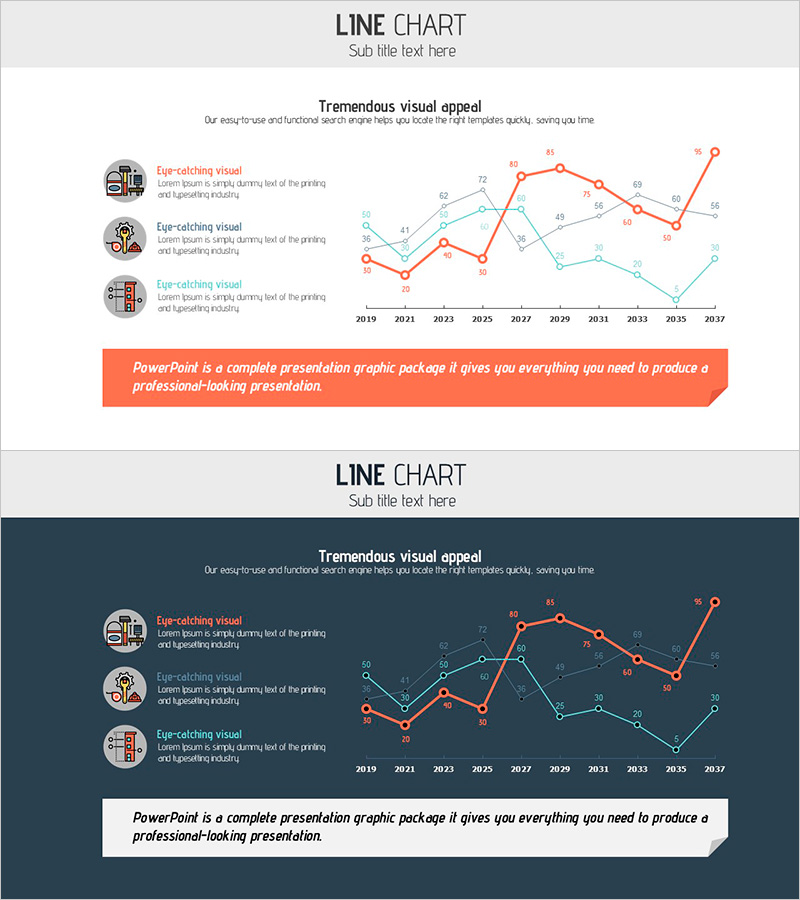
A multi-series line chart PowerPoint slide comparing long-term trends from 2019 to 2037 across three data series. The design features three distinct color lines—orange, blue, and cyan—that clearly represent numerical changes over time, with three icon illustrations and descriptive text on the left side to emphasize each series' meaning. Provided in 16:9 widescreen format with two slide layouts: a light background version and a dark background version for flexible presentation scenarios. This slide template is optimized for industry analysis, market forecasting, and performance comparison presentations in construction, manufacturing, finance, and related sectors.
Usage Points
-
Main Usage
Visualizes long-term time-series data across multiple series to show trend changes and comparative performance. Ideal for industry analysis, market forecasting, financial reporting, and strategic presentations in construction, manufacturing, finance, and marketing sectors. Effectively communicates numerical data and performance metrics to stakeholders.
-
How to Use
Simply input your actual data into the slide template for immediate use. Modify the left-side icons and descriptive text to clarify each series' meaning, and select the background version (light or dark) that matches your presentation environment. Edit data points and axis labels to reflect your specific analysis and findings.
-
Recommended For
Executives, data analysts, marketers, management consultants, and researchers presenting business performance reports, market analysis, strategic planning, investor pitch decks, and competitive benchmarking. Particularly valuable for mid-term forecasts and industry trend analysis in construction, manufacturing, finance, and technology sectors.
-
Slide Structure
Two-slide layout with each slide divided into three sections: title area at top, left side featuring three icons with explanatory text, and right side displaying the line chart. The chart includes X-axis (2019-2037), Y-axis (numerical values), and three color-coded data series (orange, blue, cyan) with data point labels. Both light background and dark background versions are included for presentation flexibility.
Related Products
-

Visualizing Future Outlook and Expected Effects – Harmony of Green and Orange
#Business Strategy #Market and Competitor Analysis #Graph
-

Business Strategy Analysis with Line Chart
#Business Strategy #Market and Competitor Analysis #Diagram
-

Technology Service Future Outlook and Expected Effect Graph – A Visual Tool for Business Strategy
#Business Strategy #Market and Competitor Analysis #Graph
-

Line Charts in Urban Background – Business Strategy and Market Analysis
#Business Strategy #Market and Competitor Analysis #Graph
