Year-by-Year Comparison Bar Chart – Market Analysis and Competitive Advantage
RJ0900009_8
- Last Update 08/18/2025
- File Size 0.1MB
- # of Slides 2
- File Format PPTX
- Slide Ratio 16:9
- Color
Keywords
- #Content-Based Slides
- #Design-Based Slides
- #Market and Competitor Analysis
- #Graph
- #Competitive Advantage
- #Horizontal Bar
- #Grouped Horizontal Bar
- #16:9
- #horizontal bar chart PowerPoint
- #year-by-year comparison slide
- #market analysis template
- #3-series data visualization
- #bar graph PowerPoint template download
About the Product
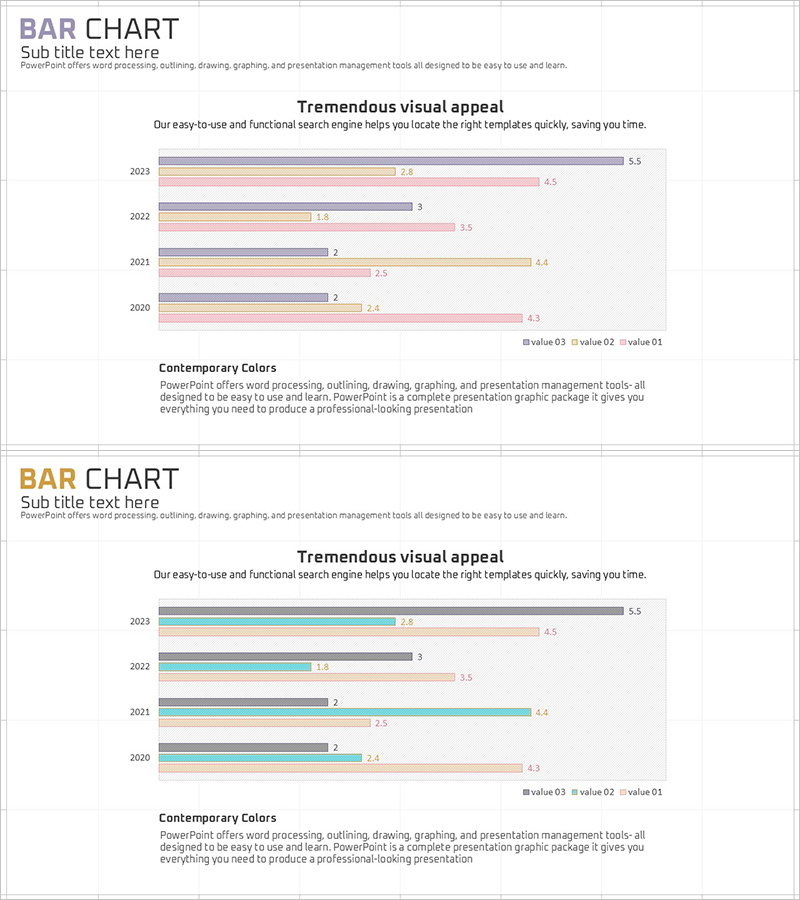
A horizontal bar chart PowerPoint slide designed to compare market data across multiple years at a glance. This presentation template visualizes 5 years of data (2020–2024) across 3 series using horizontal bars, making annual trends and inter-series differences immediately apparent. The soft color palette—gray, pink, and beige tones—suits executive reports and market analysis presentations. Organized by year in rows for easy data comparison, with clear numerical labels for immediate use. Each slide is fully editable, allowing you to input your own data and adjust colors to match your brand identity.
Usage Points
-
Main Usage
Compare year-over-year sales, market share, or competitor metrics across 3 data series simultaneously. Ideal for executive reports, quarterly performance reviews, and market research presentations where multi-year trends and inter-series gaps must be clearly communicated.
-
How to Use
Each year row displays 3 horizontal bars representing the 3 data series. Bar length and color encode the numerical values; hover over bars to see exact figures. Replace sample data with your own—bar lengths adjust automatically. Edit colors and legend labels freely to match your corporate branding.
-
Recommended For
Marketing managers, business analysts, sales directors, and finance teams presenting quarterly or annual performance comparisons. Particularly effective for competitive benchmarking, market share evolution, and product-line revenue trend analysis.
-
Slide Structure
2-slide deck. Slide 1 features gray-toned 3-series horizontal bars (5 years: 2020–2024, 3 bars per year). Slide 2 uses teal-toned 3-series bars in identical layout. Numerical labels appear at bar ends; legend (value 03, value 02, value 01) positioned at bottom.
Related Products
-

Sales Status Average Slide
#Market and Competitor Analysis #Graph #Future Outlook
-

Vertical Bar Chart Slide for Data Comparison
#Market and Competitor Analysis #Graph #Competitor Analysis
-

Market Analysis Graph by Year – Visualizing Competitive Advantage
#Market and Competitor Analysis #Graph #Market Analysis
-

Travel Guide Market Analysis by State in the United States Using Horizontal Bar Chart
#Market and Competitor Analysis #Graph #Other
