Comparative Graph of Architecture – Visualizing Competitive Advantage
RJ0900009_25
- Last Update 08/18/2025
- File Size 0.1MB
- # of Slides 2
- File Format PPTX
- Slide Ratio 16:9
- Color
Keywords
About the Product
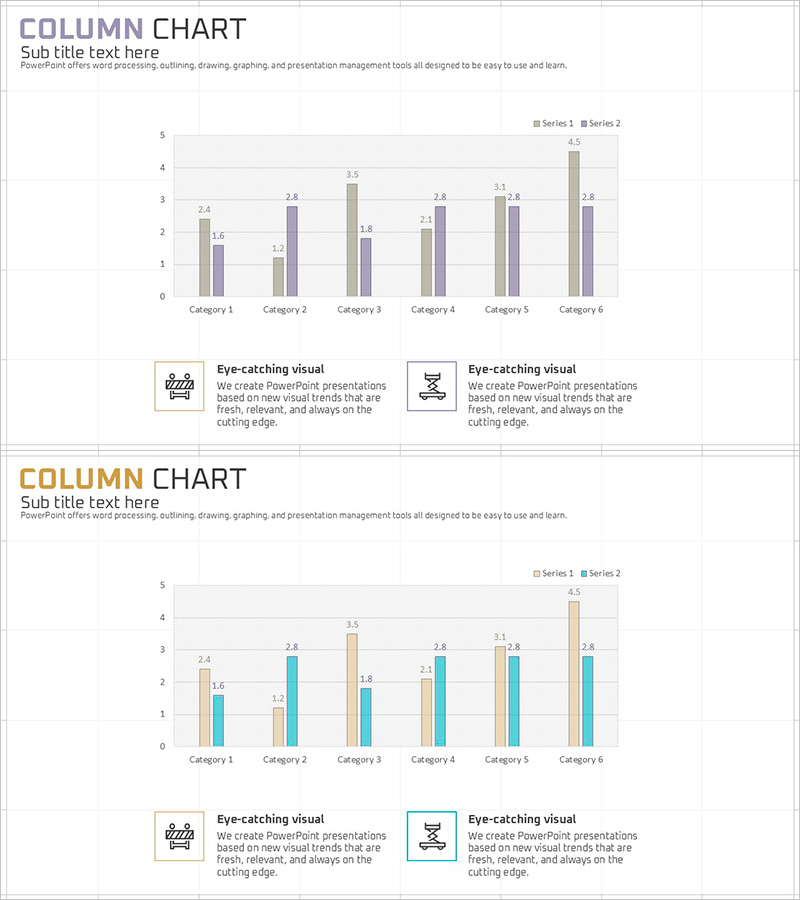
A grouped column chart PowerPoint slide comparing two data series across six categories side by side. The design uses contrasting gray and purple color schemes to clearly distinguish between Series 1 and Series 2, with numerical labels displayed above each bar for precise data reading. Horizontal gridlines enhance readability and support accurate value interpretation. This presentation slide is ready to use for competitive analysis, performance benchmarking, market research results, and business comparisons in executive presentations.
Usage Points
-
Main Usage
Designed to compare two or more data series within the same categories and highlight differences effectively. Ideal for competitive benchmarking, quarterly performance comparison, product specification comparison, market share analysis, and any business presentation requiring quantitative side-by-side analysis.
-
How to Use
Bar heights and colors immediately show the numerical differences between the two series. The legend at the top identifies Series 1 and Series 2, while numerical labels above each bar provide exact values. Background gridlines assist in reading Y-axis values. Category names and data values are fully editable to match your presentation needs.
-
Recommended For
Recommended for executives, marketing teams, sales professionals, data analysts, and consultants who base decisions on quantitative data. Suitable for quarterly earnings reports, competitive analysis presentations, product comparison proposals, market research findings, and investment pitch decks.
-
Slide Structure
Two-slide set. First slide features a grouped column chart with gray and purple series across 6 categories with numerical labels. Second slide presents the same structure with orange and teal color variation for design flexibility. 16:9 widescreen format, PPTX file type compatible with all modern PowerPoint versions for easy editing.
Related Products
-

Bundled Charts for Infinite Energy Analysis
#Market and Competitor Analysis #Graph #Market Status
-

Muscle Mass Change Graph – Market Analysis Presentation
#Market and Competitor Analysis #Graph #Market Status
-

Market Competition: Deep Dive into Top 3 Firms
#Market and Competitor Analysis #Graph #Competitor Analysis
-

Construction Equipment Usage Graph
#Market and Competitor Analysis #Graph #Competitive Advantage
