Study Topic Vertical Bar Graph – Marketing Strategy Analysis
RJ0500041_15
- Last Update 06/18/2025
- File Size 0.3MB
- # of Slides 2
- File Format PPTX
- Slide Ratio 16:9
- Color
Keywords
- #Content-Based Slides
- #Design-Based Slides
- #Market and Competitor Analysis
- #Marketing Plan and Strategy
- #Graph
- #Competitive Advantage
- #Marketing Strategy
- #Column
- #Grouped Column
- #16:9
- #vertical bar chart PowerPoint
- #dual series graph template
- #marketing analysis slide
- #data comparison chart
- #how to create bar chart in PowerPoint
About the Product
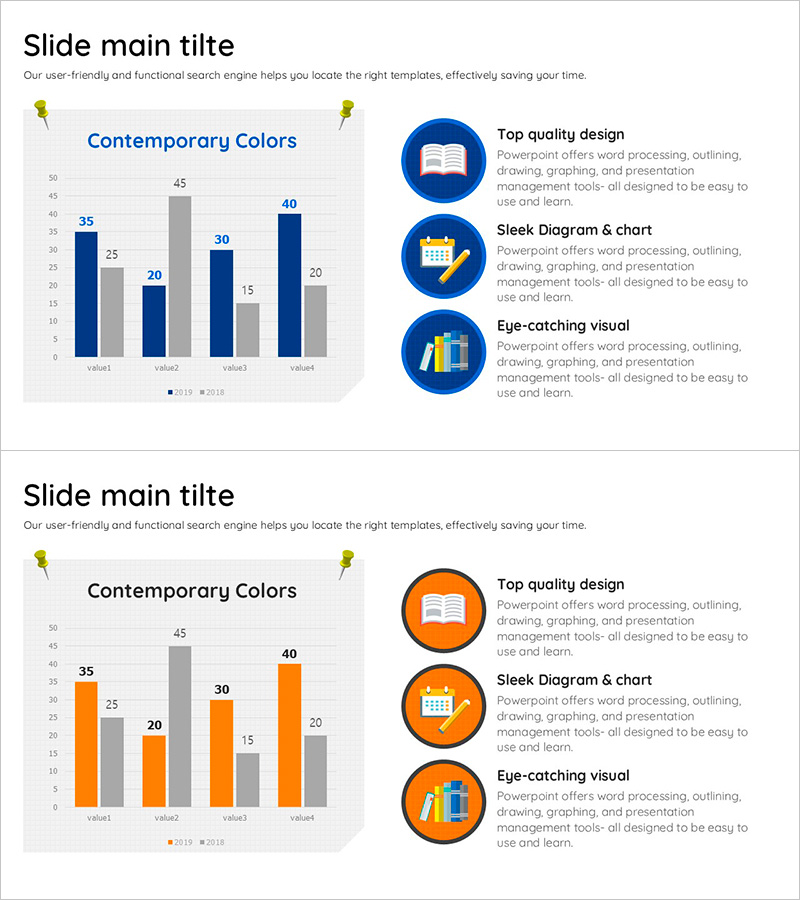
A vertical bar chart PowerPoint slide optimized for marketing strategy analysis and competitive market comparison. This dual-series bar structure displays 4 items (value1 through value4) across 2 data series (2019 and 2018), enabling simultaneous visualization of year-over-year changes and item-by-item comparisons. The blue and orange two-tone color scheme clearly differentiates data series, while the two-column layout with graph on the left and text area on the right suits both presentation decks and business reports. Delivered in 16:9 widescreen format with 2 slides, ready for immediate editing and deployment.
Usage Points
-
Main Usage
Used to visualize market data, competitive analysis, and sales performance comparisons during marketing strategy development. Ideal for year-over-year comparisons, regional or product-line performance analysis, target versus actual results, and competitive advantage identification where quantitative evidence is essential.
-
How to Use
Input actual data into the left graph area and bar heights adjust automatically. Add analysis findings, insights, and action items in the right text box. Blue and orange series colors are fully customizable to match corporate branding, and the 2-slide format allows sequential presentation of multiple analysis topics.
-
Recommended For
Recommended for marketing professionals, strategy planning teams, sales managers, and executive reporting. Ideal for business plans, marketing strategy documents, quarterly performance reports, investor pitch decks, and competitive analysis materials where quantitative data substantiation is required.
-
Slide Structure
Each slide features a dual-series vertical bar chart on the left (4 items × 2 series: 2019 and 2018) with 3 circular icons (book, calculator, building) and descriptive text area on the right. Chart title 'Contemporary Colors' appears at top with legend (2019, 2018) at bottom for data interpretation support.
Related Products
-

Modern Blue Presentation Column Chart – Market and Competitive Analysis
#Market and Competitor Analysis #Marketing Plan and Strategy #Graph
-

Analyze Sales Performance with Geometric Pattern Wide Bar Chart
#Market and Competitor Analysis #Financial Plans and Performance #Graph
-

Bundled Graphs and Maps for Business Plan Visualization
#Market and Competitor Analysis #Graph #Other
-

Competitive Companies Comparison Graph – A Powerful Tool for Market Analysis
#Market and Competitor Analysis #Diagram #Graph
