Purple Brown Competitive Advantage Donut Graph – Visualizing Market Share
RJ0900009_20
- Last Update 08/18/2025
- File Size 0.1MB
- # of Slides 2
- File Format PPTX
- Slide Ratio 16:9
- Color
Keywords
- #Content-Based Slides
- #Design-Based Slides
- #Market and Competitor Analysis
- #Graph
- #Market Share
- #Competitive Advantage
- #Circles
- #Doughnut Chart
- #16:9
- #donut chart PowerPoint
- #pie chart slide template
- #market share visualization
- #competitive analysis PPT
- #data visualization presentation
- #business analytics slide
About the Product
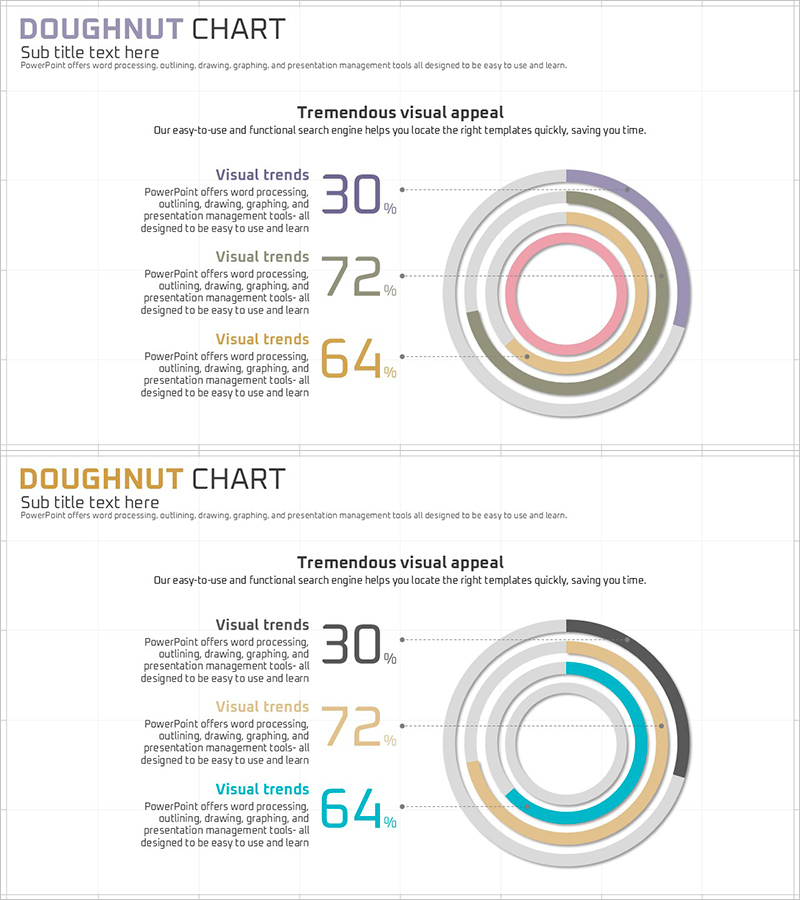
A multi-layered donut chart PowerPoint slide that visualizes market share and competitive advantage through three concentric rings. The purple, brown, and gray color palette clearly differentiates data series, with percentage values displayed on each segment for quantitative analysis. This 2-slide set is ready to use in various business analysis presentations. The hollow center of the donut provides space for inserting key messages, logos, or supplementary information, enhancing information hierarchy and visual impact.
Usage Points
-
Main Usage
Ideal for expressing multi-layered ratio data such as market share, competitor comparison, and revenue composition by business segment. The hollow center allows insertion of key metrics or brand logos, enabling effective information layering and visual emphasis.
-
How to Use
Deploy in business presentations, investor pitch decks, quarterly performance reports, and marketing strategy meetings during competitive landscape analysis sections. Edit each layer's colors and values with your own data for immediate presentation use.
-
Recommended For
Suited for executives, marketing professionals, business analysts, consultants, and investor presentations. Particularly effective in strategy meetings and board reports where multi-variable comparison and data credibility are essential.
-
Slide Structure
Three concentric donut rings with distinct color coding (purple, brown, gray). Each segment displays percentage values and legend labels. The 2-slide format accommodates various data combinations and comparative scenarios.
Related Products
-

Running Silhouette Donut Chart
#Market and Competitor Analysis #Graph #Market Share
-

Market Share and Competitive Advantage via Bar and Donut Charts – Product Satisfaction Survey
#Market and Competitor Analysis #Graph #Market Share
-

Green Red Donut Chart – Market Share Analysis
#Market and Competitor Analysis #Graph #Market Share
-

Fashion Design Comparative Donut Chart – Market Share Analysis
#Market and Competitor Analysis #Graph #Market Share
