Purple Brown Market Share Analysis – Emphasizing Visual Appeal
RJ0900009_19
- Last Update 08/18/2025
- File Size 0.5MB
- # of Slides 2
- File Format PPTX
- Slide Ratio 16:9
- Color
Keywords
About the Product
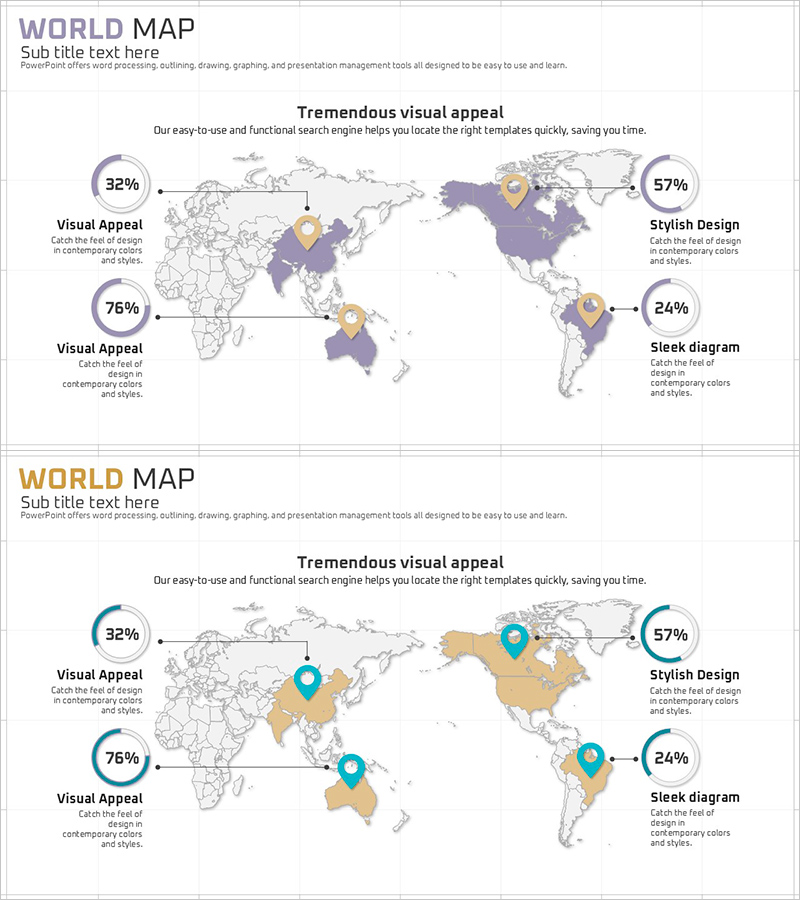
A 2-slide PowerPoint template featuring donut charts for market share analysis and data visualization. The slides use a purple, brown, and beige color palette to clearly represent four data segments with circular icons and text labels for each section. This pie chart-style presentation slide is ready to use for executive reports, marketing analysis, and business performance presentations. The 16:9 widescreen format ensures optimal display on all screens and devices.
Usage Points
-
Main Usage
Visualize and compare four data segments such as market share, sales ratio, or customer composition using donut chart design. The color-coded sections and percentage labels make data comparison intuitive and suitable for decision-making presentations.
-
How to Use
Apply to market analysis sections in executive reports, customer demographic breakdowns in marketing plans, and revenue composition in business performance presentations. Insert your data values and percentages into the labeled sections for immediate presentation use.
-
Recommended For
Marketing managers, executives, business analysts, and finance professionals presenting quarterly reports, market research findings, and performance reviews. Ideal for any presentation requiring ratio-based data comparison and visual impact.
-
Slide Structure
Two-slide set with the first slide featuring a purple-toned donut chart (4 segments) and the second slide in brown and beige tones (4 segments). Each slide includes four circular icons, text labels, and percentage display areas arranged in 16:9 widescreen format.
Related Products
-

Donut Chart & Map Template for Social Network Visualization
#Market and Competitor Analysis #Graph #Other
-

Doughnut Chart Slide Visualizing Market Share by Country
#Market and Competitor Analysis #Graph #Other
-

Analyzing ABC District Occupancy with Doughnut Chart
#Market and Competitor Analysis #Graph #Other
-

Mokup and Turnout Analysis Chart – Analyze with Visual Data
#Market and Competitor Analysis #Graph #Other
