Market Trend Visualized with Vertical Bar Graph
RJ0600015_5
- Last Update 06/24/2025
- File Size 2.7MB
- # of Slides 2
- File Format PPTX
- Slide Ratio 16:9
- Color
Keywords
- #Content-Based Slides
- #Design-Based Slides
- #Market and Competitor Analysis
- #Graph
- #Competitor Analysis
- #Competitive Advantage
- #Column
- #Grouped Column
- #16:9
- #vertical bar chart PowerPoint
- #clustered column chart template
- #data comparison slide
- #market trend graph PPT
- #two-series bar chart presentation
About the Product
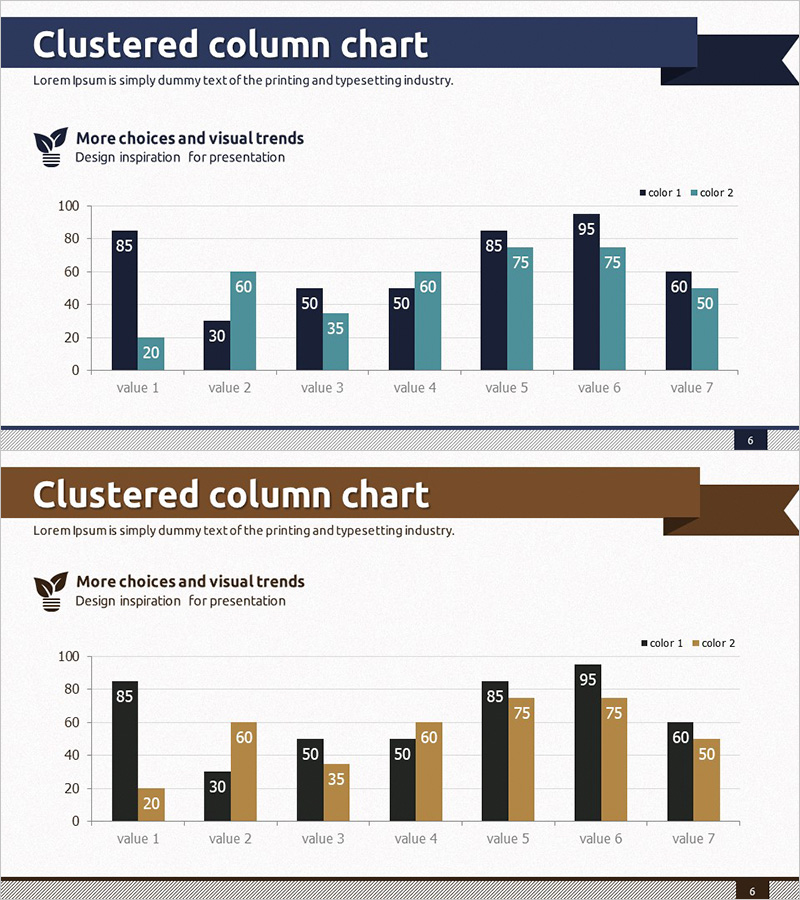
A professional vertical bar chart PowerPoint slide designed to visualize market trends and competitive analysis with clarity and impact. This clustered column chart displays 7 data items across 2 series side by side, enabling intuitive comparison of values and trend patterns. The design combines navy and dark gray base colors with teal accent highlights for a corporate aesthetic, with an alternative brown and gold color scheme included. Data labels appear above each bar for precise value reference, making it ideal for business plans, quarterly reports, marketing presentations, and investor pitch decks. Delivered as an editable PPTX file in 16:9 widescreen format with 2 slides.
Usage Points
-
Main Usage
Compare two-series numerical data across multiple categories such as market trends, competitive positioning, sales performance, or departmental metrics. The labeled bars enable audiences to quickly grasp exact values while visually comparing relative magnitudes across items.
-
How to Use
Insert into business plans, quarterly performance reports, marketing strategy presentations, or investor relations materials in the market analysis or results comparison section. Simply edit the item labels, data values, and series names to match your dataset for immediate presentation use.
-
Recommended For
Executives, marketing managers, sales leaders, financial analysts, management consultants, and data-driven decision makers. Particularly effective for quarterly or annual performance reviews, competitive benchmarking presentations, market share analysis, and cross-departmental performance comparisons.
-
Slide Structure
Both slides feature identical layout: title area at top, 7 data items (value 1–7) with 2 clustered vertical bars (color 1 and color 2) displayed side by side. Numeric labels positioned above each bar. Legend positioned in upper right. Two color schemes provided: navy/teal and brown/gold versions.
Related Products
-

Four Color Infographic Bar Chart Template – Visualize Your Competitive Advantage
#Market and Competitor Analysis #Graph #Competitor Analysis
-

Business Analysis Chart – Visualizing Competitive Advantage
#Market and Competitor Analysis #Graph #Other
-

Office Supplies Theme Competitive Analysis Bar Graph
#Market and Competitor Analysis #Graph #Competitor Analysis
-

Competitiveness Table and Chart Analysis – Market and Competitor Analysis
#Market and Competitor Analysis #Diagram #Graph
