Red Sky Donut Chart – Market Share Analysis
RJ0600065_4
- Last Update 07/07/2025
- File Size 0.1MB
- # of Slides 2
- File Format PPTX
- Slide Ratio 16:9
- Color
Keywords
- #Content-Based Slides
- #Design-Based Slides
- #Company Introduction
- #Market and Competitor Analysis
- #Graph
- #Key Achievements
- #Market Share
- #Circles
- #Doughnut Chart
- #16:9
- #donut chart PowerPoint
- #pie chart slide template
- #ratio comparison graph
- #donut chart template download
- #3-segment chart PowerPoint slide
About the Product
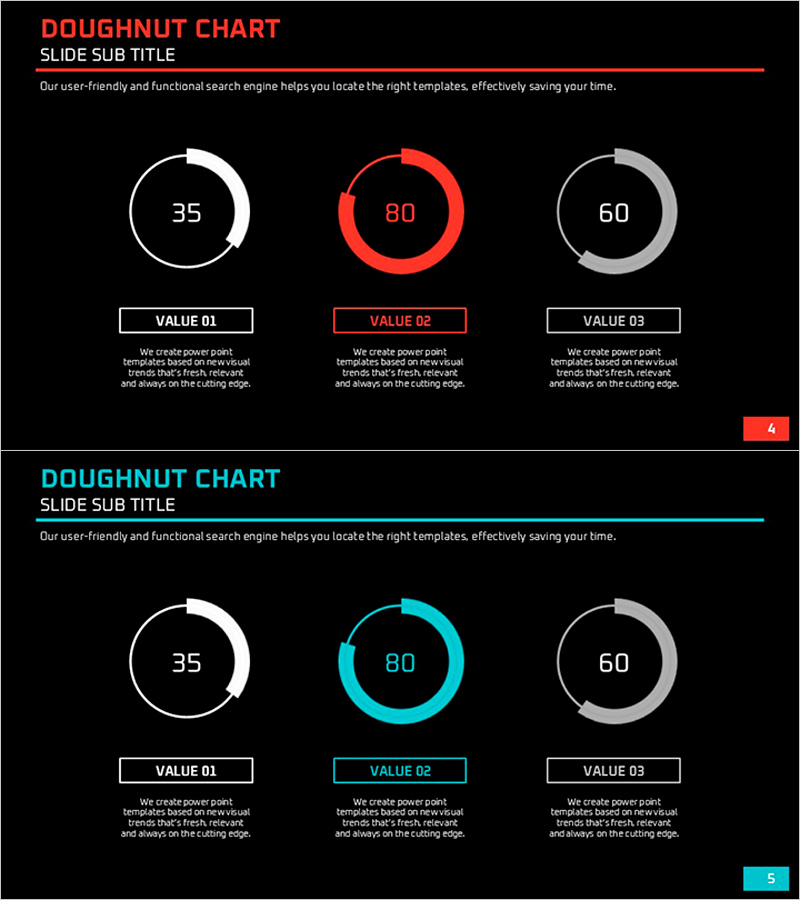
A PowerPoint slide featuring three donut charts to visualize numerical ratios across three categories. The design uses red, white, and gray color schemes to highlight key data points, with labels and descriptive text areas beneath each chart. Set against a black background for maximum contrast and visual impact, this slide template is ready for immediate use in market share analysis, sales ratio comparisons, and customer composition presentations. The 16:9 widescreen format includes 2 slides that can be customized for various presentation scenarios.
Usage Points
-
Main Usage
Designed to visually compare and analyze numerical ratios across three categories. Ideal for presenting market share, sales distribution, customer demographics, budget allocation, and departmental composition in a clear, at-a-glance format.
-
How to Use
Replace the center numbers and labels on each donut chart with your own data values. Adjust the color emphasis (red, white, gray) to highlight priority items, or customize colors to match your corporate brand. Add analysis details in the text areas below each chart to complete the slide.
-
Recommended For
Recommended for executive reports, business analysis presentations, marketing performance reviews, financial reporting, organizational structure introductions, and customer analytics. Particularly valuable for professionals in management, marketing, sales, and planning roles requiring quantitative ratio comparisons.
-
Slide Structure
Two-slide set with three donut charts arranged horizontally on each slide. Each chart displays a numerical value in the center with labels and descriptive text boxes below. The black background provides strong color contrast to emphasize data visualization and ensure presentation impact.
Related Products
-

Doughnut Chart for Market Share Analysis – Performance and Trends
#Company Introduction #Market and Competitor Analysis #Graph
-

Conservation Donut Chart – Visualization of Sustainability
#Company Introduction #Market and Competitor Analysis #Diagram
-

Rainbow Presentation Template Doughnut Chart – Start Your Unique Analysis
#Company Introduction #Market and Competitor Analysis #Graph
-

Visualizing Physical Championship Winning Status with Doughnut Chart
#Company Introduction #Market and Competitor Analysis #Graph
