Area Graph & Notebook Mockup for Market Trend Analysis
RJ0300050_6
- Last Update 05/01/2025
- File Size 0.9MB
- # of Slides 2
- File Format PPTX
- Slide Ratio 16:9
- Color
Keywords
About the Product
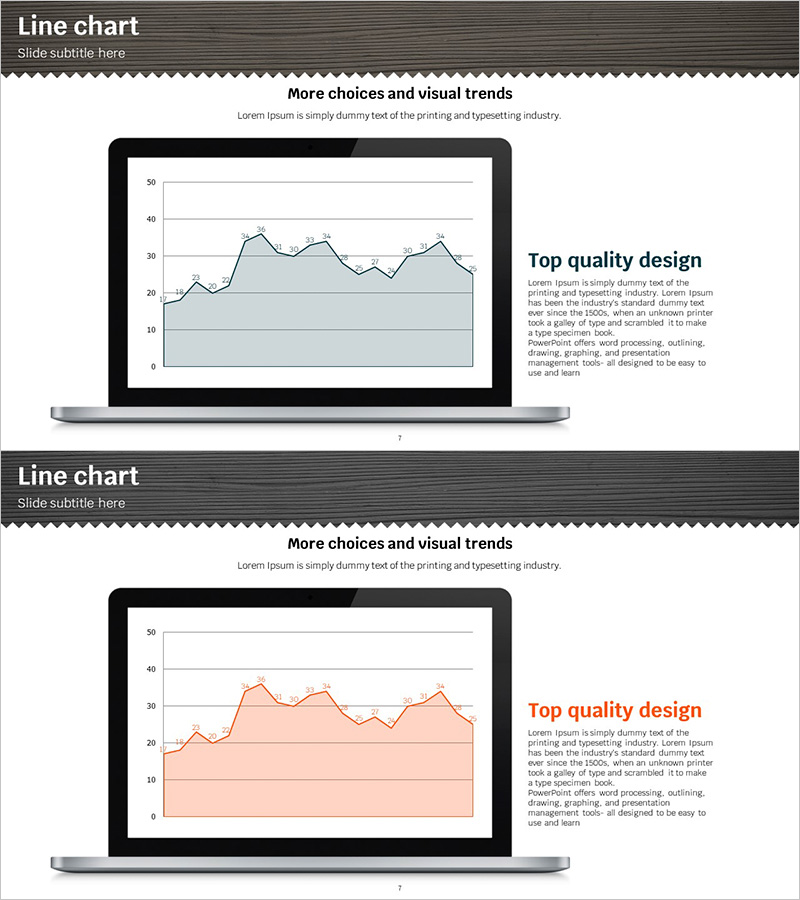
A professional PowerPoint presentation combining area charts and notebook device mockups to visualize market trends and business data. The area graphs in gray and coral tones clearly display data progression over time, while the notebook mockup enhances presentation credibility. This 2-slide set adapts to various data scenarios and is ready for immediate use in marketing reports, business analysis presentations, investor pitches, and executive briefings. Delivered in 16:9 widescreen PPTX format, fully editable across all PowerPoint versions.
Usage Points
-
Main Usage
Communicate data trends and cumulative changes through area charts while establishing credibility via device mockup framing. Ideal for visualizing marketing performance, sales progression, market share evolution, and other accumulated metrics that benefit from area-based representation.
-
How to Use
Slide 1 presents baseline trends using gray-toned area graph; Slide 2 offers comparative analysis in coral tones. Charts are positioned within notebook screens to simulate real-world application contexts. All numerical values, legends, and text annotations are fully editable to match your specific dataset.
-
Recommended For
Marketing managers, business analysts, financial reporting specialists, and executives preparing performance reviews. Ideal for quarterly business reviews, market research presentations, investor relations meetings, and strategic planning sessions where data credibility is paramount.
-
Slide Structure
2-slide layout with one notebook mockup per slide containing an embedded area chart. Each chart features X-axis (time/period) and Y-axis (value/percentage) with dual-series area fills in gray and coral. Right-aligned text zones accommodate analysis commentary and key insights.
Related Products
-

Area Chart for Market Trend Analysis – Insights and Growth
#Market and Competitor Analysis #Financial Plans and Performance #Graph
-

Newspaper Wide PowerPoint Template Area Chart – Market Analysis and Strategy
#Market and Competitor Analysis #Marketing Plan and Strategy #Graph
-

Distribution Graph of Food Materials – Market Status Chart
#Market and Competitor Analysis #Graph #Other
-

Bar Chart Visualizing Yacht Tour Satisfaction
#Market and Competitor Analysis #Graph #Other
