Area Chart for Future Sales Target Achievement – Vision of Success
RJ0900007_23
- Last Update 08/17/2025
- File Size 0.1MB
- # of Slides 2
- File Format PPTX
- Slide Ratio 16:9
- Color
Keywords
About the Product
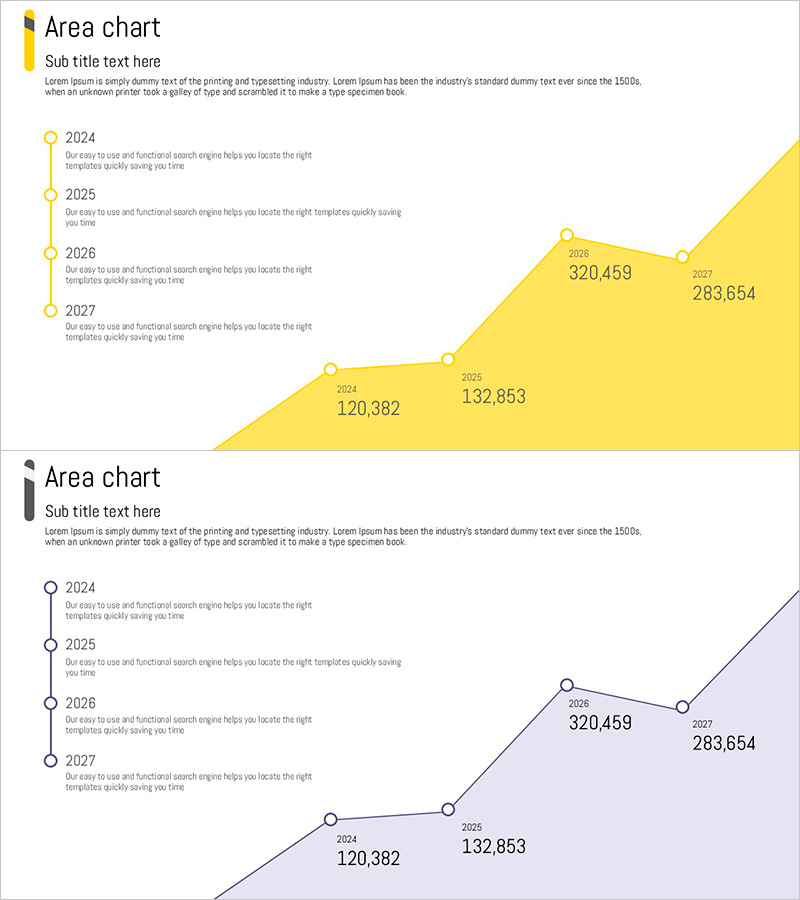
This slide features an area chart visually representing the future sales target achievement. The adopted yellow and purple tones symbolize positive growth, effectively highlighting financial performance. With a clear chart structure showcasing projected sales from 2024 to 2027, it appeals to investors and executives alike. This template is suitable for presentations on business strategies and revenue forecasts, conveying data and statistics effectively. Users can easily edit the text and data, rated as 'easy' in editing difficulty for quick application.
Usage Points
-
Main Usage
- This template is designed for business presentations focusing on future sales projections, making it ideal for strategic meetings and investor briefings.
-
How to Use
- Users can incorporate this template during quarterly business reviews, where they can effectively communicate sales forecasts and financial expectations to stakeholders.
-
Recommended For
- This template is best suited for business analysts, financial strategists, and executives who need to present data in a clear and visually appealing manner.
-
Slide Structure
- The overall flow includes an introduction to sales targets, a detailed area chart illustrating expected growth, and a conclusion that summarizes key insights, ensuring a comprehensive understanding of the data presented.
Related Products
-

Revenue Model and Sales Performance Chart – Predicting Business Success
#Business Strategy #Financial Plans and Performance #Graph
-

Camera and Vertical Stacked Charts Slide
#Business Strategy #Financial Plans and Performance #Graph
-

Visualizing Product Sales Performance and Future Outlook with Horizontal Bar Chart
#Business Strategy #Financial Plans and Performance #Graph
-

Horizontal Bar Chart Visualizing Market Sales Status
#Market and Competitor Analysis #Financial Plans and Performance #Graph
