Revenue Model and Sales Performance Chart – Predicting Business Success
RJ0700031_5
- Last Update 10/07/2025
- File Size 10.5MB
- # of Slides 2
- File Format PPTX
- Slide Ratio 16:9
- Color
Keywords
- #Content-Based Slides
- #Design-Based Slides
- #Business Strategy
- #Financial Plans and Performance
- #Graph
- #Text Box
- #Other
- #Financial Outlook & Expected Impact
- #Sales and Revenue
- #Rounded Rectangle Text Box
- #16:9
- #revenue model PowerPoint slide
- #sales forecast presentation
- #pricing tier comparison slide
- #business growth chart PPT
- #investor pitch deck revenue structure
About the Product
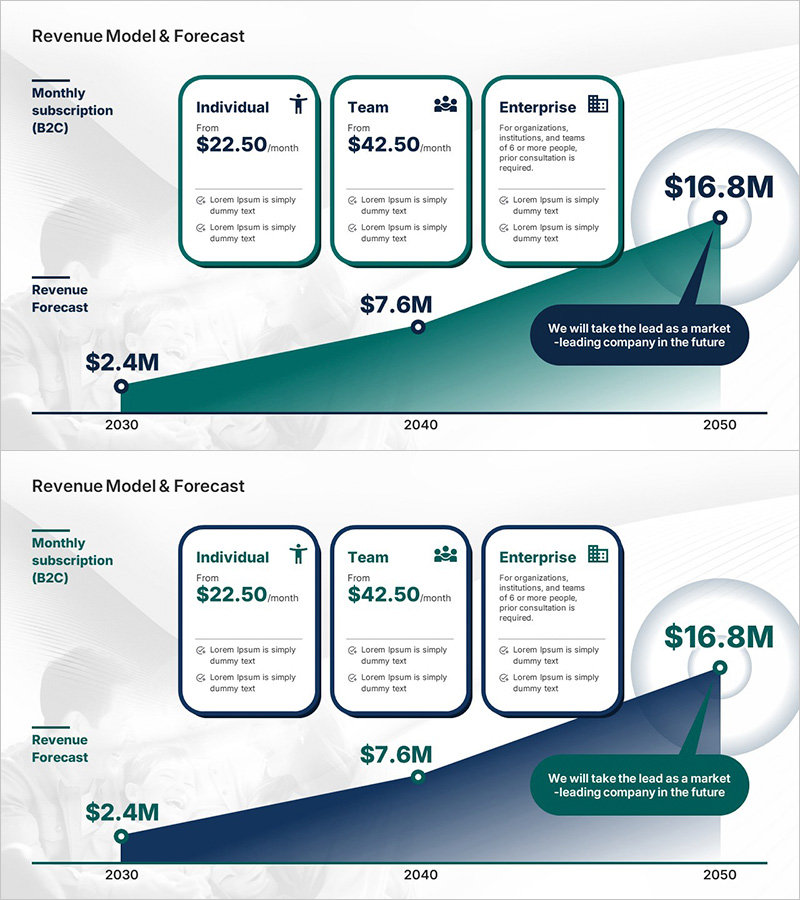
A 2-slide PowerPoint presentation visualizing B2C subscription revenue models and sales forecasts. Three pricing tiers—Individual, Team, and Enterprise—are displayed in rounded rectangular cards, with a revenue growth curve spanning 2030 to 2050 positioned on the right. The teal-green gradient curve contrasts against a white background, maintaining consistent layout across both slides. Ideal for investor presentations, business plans, and financial performance reports to effectively communicate revenue structure and growth projections. Fully editable PPTX format.
Usage Points
-
Main Usage
Communicate B2C subscription business revenue models and sales growth projections to investors and executives. The slide clearly compares three pricing tiers and displays 2030–2050 revenue forecasts in a single visual, making financial projections immediately understandable.
-
How to Use
Use in investor relations (IR) presentations, business plan financial sections, and quarterly performance reports to explain revenue structure and growth scenarios. Edit pricing card text and figures with your company data, and update graph years and revenue amounts with actual forecasts.
-
Recommended For
CFOs, finance managers, investor relations teams, and business development professionals at startups and SaaS companies. Applicable to any presentation requiring explanation of subscription-based business models.
-
Slide Structure
Both slides share identical layout: 'Monthly subscription (B2C)' label at top left, three pricing cards in center (Individual $22.50/month, Team $42.50/month, Enterprise), revenue forecast curve on right ($2.4M→$7.6M→$16.8M) with callout box. Six editable text areas: three pricing descriptions, three revenue figures, one quote box.
Related Products
-

Area Chart for Future Sales Target Achievement – Vision of Success
#Business Strategy #Financial Plans and Performance #Graph
-

Visualizing the Changing Trend of the Ageing Population with a 100% Stacked Bar Graph
#Business Strategy #Market and Competitor Analysis #Marketing Plan and Strategy
-

Graph Comparing Performance by Major Business Divisions - Efficient Financial Planning
#Market and Competitor Analysis #Financial Plans and Performance #Graph
-

Mixed Charts and Customer Analysis – Visualizing Customer Insights
#Market and Competitor Analysis #Financial Plans and Performance #Graph
