Line Graph and Key Messages – Market Outlook Analysis
RJ0500013_8
- Last Update 06/10/2025
- File Size 5.2MB
- # of Slides 2
- File Format PPTX
- Slide Ratio 16:9
- Color
Keywords
About the Product
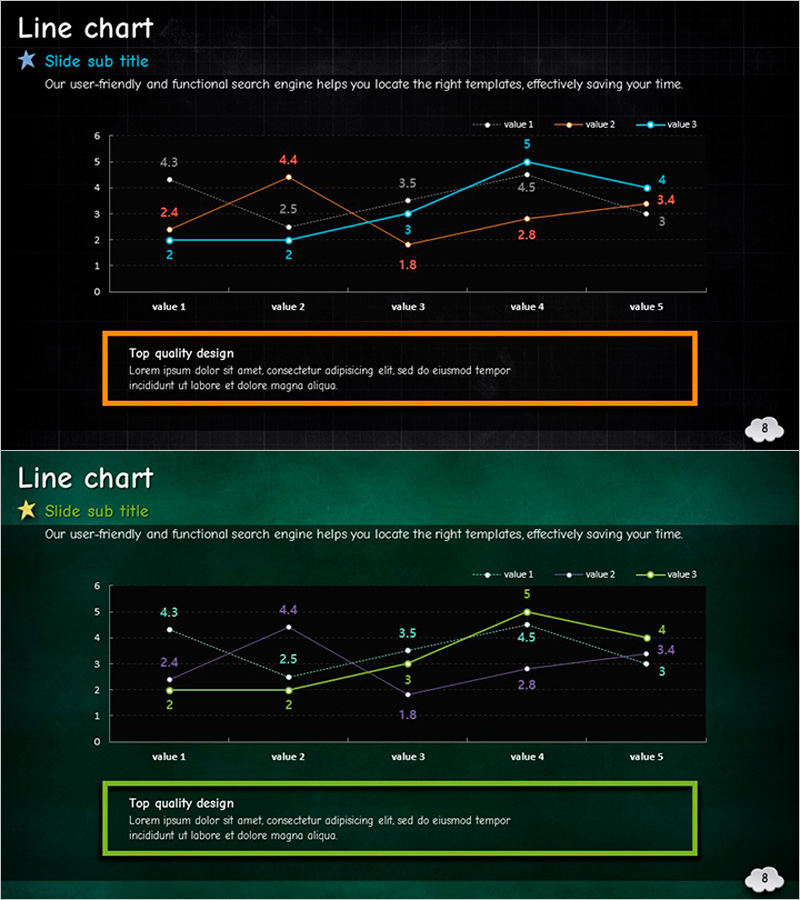
A professional line chart PowerPoint slide designed for market outlook and competitive analysis presentations. Three data series in orange, white, and blue track five monthly data points against a dark background, with each value clearly labeled for precise numerical comparison. The bottom section features a highlighted text box for key insights or conclusions. Two color variants are included—black background and deep teal background—allowing you to match your presentation's visual tone. Delivered in 16:9 widescreen PPTX format, fully editable and ready to customize with your own data.
Usage Points
-
Main Usage
Visualize time-series data across three comparable metrics—such as market trends, competitor performance, or revenue growth—with precise numerical labels at each data point. The highlighted message box below the chart allows you to emphasize key findings or strategic implications, strengthening presentation impact.
-
How to Use
Ideal for business plans, investor pitch decks, quarterly performance reports, and market analysis presentations. Use the black background version for premium corporate settings and the teal version for trust-focused financial or strategic presentations. Simply replace the sample data and legend labels with your actual figures and metrics.
-
Recommended For
Executives, marketing teams, sales leaders, and strategic planners presenting quarterly performance, market share evolution, customer satisfaction trends, or competitive benchmarking. Most effective when comparing three or more entities (your company vs. competitors, regional performance, product lines, etc.).
-
Slide Structure
Two-slide set: Slide 1 features a black background with a 3-series line chart (5 data points, legend included) and an orange accent box for key messages. Slide 2 mirrors the layout with a deep teal background and matching teal accent box. Both slides are optimized for 16:9 widescreen display on modern projectors and screens.
Related Products
-

Commuting Public Transportation Status Graph – Market Analysis and Outlook
#Market and Competitor Analysis #Graph #Future Outlook
-

Line Graph Market Research by Year – Market Trend Analysis
#Market and Competitor Analysis #Graph #Future Outlook
-

Line Charts for Design Tasks – Market and Competitor Analysis
#Market and Competitor Analysis #Graph #Future Outlook
-

Current Status Graph Analysis and Forecast – Market and Competitor Analysis
#Market and Competitor Analysis #Graph #Future Outlook
