Body Fat Change After Running – Market Analysis
RJ0800024_5
- Last Update 08/06/2025
- File Size 1MB
- # of Slides 2
- File Format PPTX
- Slide Ratio 16:9
- Color
Keywords
- #Content-Based Slides
- #Design-Based Slides
- #Market and Competitor Analysis
- #Graph
- #Customer Analysis
- #Industry Trends
- #Column
- #Segmented Column
- #16:9
- #vertical bar chart PowerPoint
- #year-over-year data comparison slides
- #body fat change visualization
- #market analysis graph template
- #multi-series bar chart PowerPoint
- #data visualization slide template
About the Product
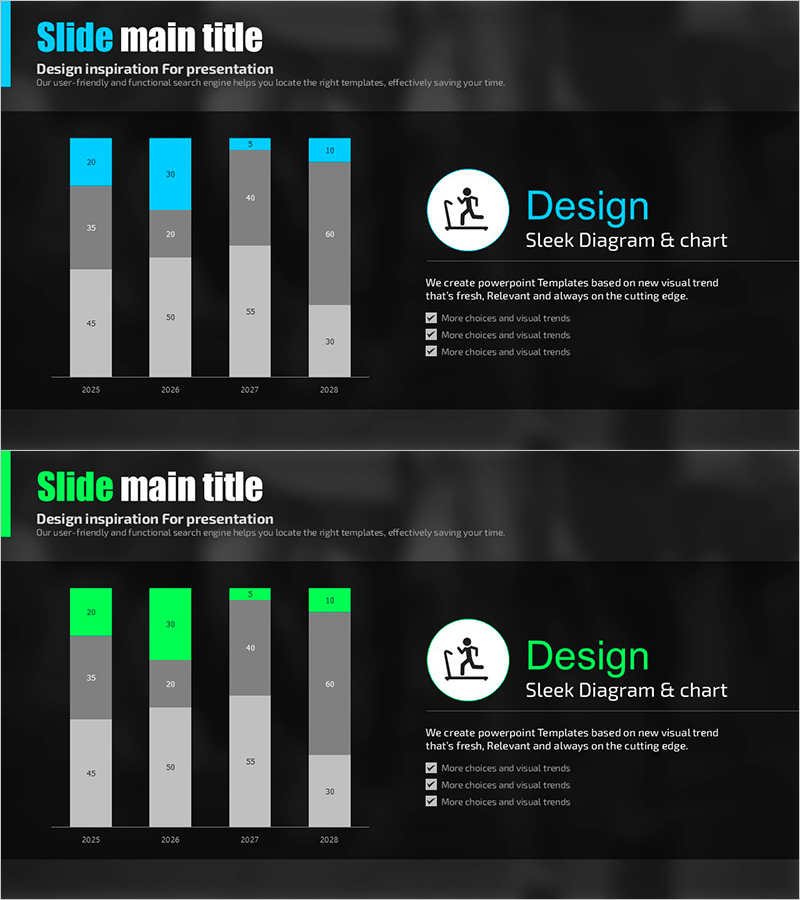
A vertical bar chart PowerPoint slide comparing body fat changes after running across four years (2025–2028) with three data series displayed in distinct colors (cyan, gray, and light gray). This presentation slide is optimized for market analysis reports and business data visualization. The dark background with clear numerical labels enables audiences to grasp trends at a glance, making it ideal for immediate use in corporate presentations. The 16:9 widescreen format includes 2 slides suitable for business reports, marketing plans, and data analysis presentations.
Usage Points
-
Main Usage
Compares numerical data across multiple years or categories using three distinct data series, clearly illustrating trend changes. Ideal for analyzing fat loss rates, sales volumes, market share, and other multi-metric indicators, helping audiences intuitively grasp numerical differences.
-
How to Use
Insert into the market analysis, performance analysis, or comparative analysis sections of your presentation to strengthen data credibility. Replace bar values with actual data and customize colors to match your brand palette for immediate use. Deploy in reports, proposals, and investor presentations to provide quantitative evidence.
-
Recommended For
Marketing managers, data analysts, sales directors, and executives presenting performance reports benefit from this slide. Particularly suited for health, fitness, and sports industry materials, medical and wellness presentations, and business performance analysis documents.
-
Slide Structure
Two-slide set featuring the first slide with cyan accent and the second with lime green accent. Each slide displays 4 years (2025–2028) × 3 data series in vertical bars totaling 12 data points, with numerical labels and legend clearly positioned for readability.
Related Products
-

Target Analysis Subdivided Vertical Bar Graph – Harmonizing Blue and Green
#Market and Competitor Analysis #Graph #Customer Analysis
-

Camping Business Trend Graph – Future and Vision
#Market and Competitor Analysis #Graph #Customer Analysis
-

Change Trend According to Situation – Market Trends and Analysis
#Market and Competitor Analysis #Graph #Customer Analysis
-

Segmented Vertical Bar Graph Blue Yellow – Customer Analysis and Market Trends
#Market and Competitor Analysis #Graph #Customer Analysis
