Table and Positioning – Marketing Strategy Analysis Slide
RJ0900005_15
- Last Update 08/16/2025
- File Size 0.8MB
- # of Slides 2
- File Format PPTX
- Slide Ratio 16:9
- Color
Keywords
About the Product
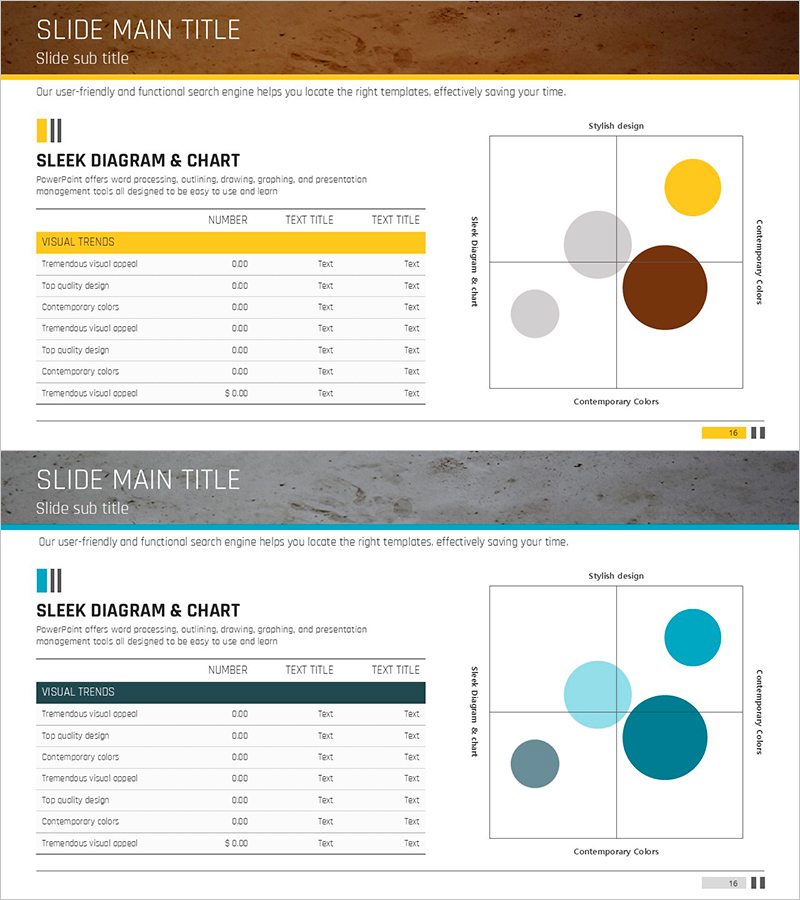
A 2-slide PowerPoint presentation for marketing strategy analysis and competitive positioning. The first slide features a yellow-highlighted header with a data table structure, combining visual trends and numerical information in a clear format. The second slide presents a bubble chart positioning map for 2-axis competitive analysis. The design uses a restrained color palette of brown, yellow, gray, and teal tones with a structured grid layout, making it immediately applicable to financial reports, marketing plans, and business analysis presentations. Provided in PPTX format with 16:9 aspect ratio, all text and numerical values are fully editable.
Usage Points
-
Main Usage
Visually communicate market analysis and competitive positioning during marketing strategy development. The table slide clearly organizes key metrics and performance data, while the positioning map provides intuitive 2-axis analysis showing your company's competitive position.
-
How to Use
Use in marketing plans, business analysis reports, and investor pitch presentations. Input actual market data, revenue, or customer satisfaction metrics into the table, and adjust positioning map axes and bubble placement to match your strategic positioning.
-
Recommended For
Marketing managers, strategy planning teams, executive briefings, investor presentations, and consulting project pitches. Ideal for any business presentation requiring competitive analysis, market positioning, or performance evaluation.
-
Slide Structure
Slide 1: Title area + descriptive text + yellow accent header + 3-column data table (NUMBER and TEXT TITLE columns) + 7-row data entry fields. Slide 2: Title area + descriptive text + 2-axis positioning map (horizontal and vertical axis labels) + 4 bubble elements (size and color differentiation) + right-side legend area.
Related Products
-

Market Distribution Analysis Positioning Map – Strengthening Competitiveness
#Market and Competitor Analysis #Marketing Plan and Strategy #Diagram
-

Positioning Market Analysis Chart – Understanding Markets and Strategies
#Market and Competitor Analysis #Marketing Plan and Strategy #Diagram
-

Point Distribution Positioning Map – Visualization of Marketing Strategy
#Marketing Plan and Strategy #Diagram #Graph
-

Competitor Positioning Graph – Diagram for Market Analysis
#Market and Competitor Analysis #Marketing Plan and Strategy #Diagram
