Free Gauge Donut Chart – A New Standard in Visual Data Representation
RJ0900005_11
- Last Update 08/16/2025
- File Size 0.8MB
- # of Slides 2
- File Format PPTX
- Slide Ratio 16:9
- Color
Keywords
About the Product
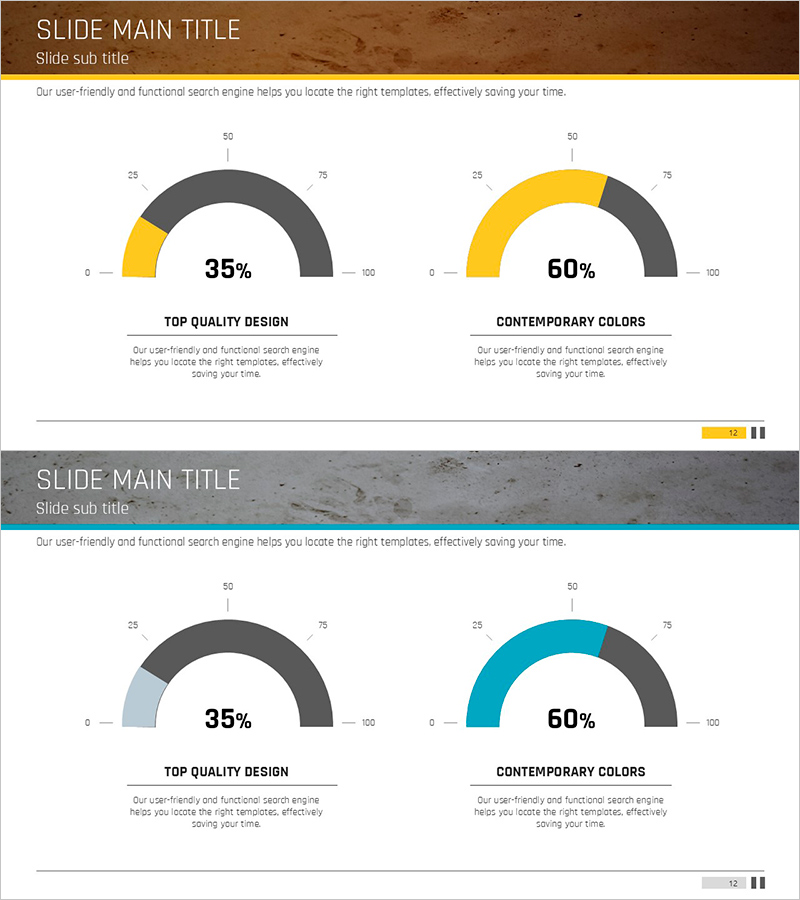
Gauge donut chart PowerPoint slides for intuitive numerical data representation. This 2-slide presentation deck uses charcoal gray and yellow tones to emphasize key metrics, with a 0–100% gauge format that clearly communicates performance, achievement rates, and progress status. Each slide features two donut charts in a side-by-side layout, enabling easy comparative analysis. Ample text description areas allow you to provide data context alongside visuals. Optimized for modern 16:9 widescreen presentations, all elements are fully editable for immediate use.
Usage Points
-
Main Usage
Visualize numerical data within 0–100% range such as performance metrics, achievement rates, and progress status using gauge format. The donut chart's center space displays key figures for instant recognition, while charcoal-to-yellow color contrast clearly distinguishes achieved versus unmet portions.
-
How to Use
Apply to KPI sections in business reports, marketing performance presentations, project status updates, quarterly goal achievement analysis, and stakeholder briefings. Edit chart values and labels to input actual data, and adjust colors as needed to align with brand guidelines.
-
Recommended For
Executive business reports, marketing team campaign performance presentations, project manager progress updates, sales team goal achievement briefings, educational seminars, and statistical data presentations.
-
Slide Structure
2-slide deck with 2 gauge donut charts per slide arranged in 2-column layout. Each chart displays a semicircular gauge on 0–100 scale with percentage figures centered. Charcoal gray background areas and yellow accent areas visually distinguish achievement levels. Label text areas at the bottom allow addition of item names and descriptions.
Related Products
-

Business Analysis Graph Slide - Market and Competitor Analysis
#Market and Competitor Analysis #Graph #Market Analysis
-

U.S. Target Region Distribution – Market Analysis
#Market and Competitor Analysis #Marketing Plan and Strategy #Graph
-

Key Personnel Work Competency Assessment Slide - Customer Analysis and Manpower
#Company Introduction #Market and Competitor Analysis #Diagram
-

Competitor Comparison Analysis Graph - Optimized for Market and Competitor Analysis
#Market and Competitor Analysis #Graph #Competitor Analysis
