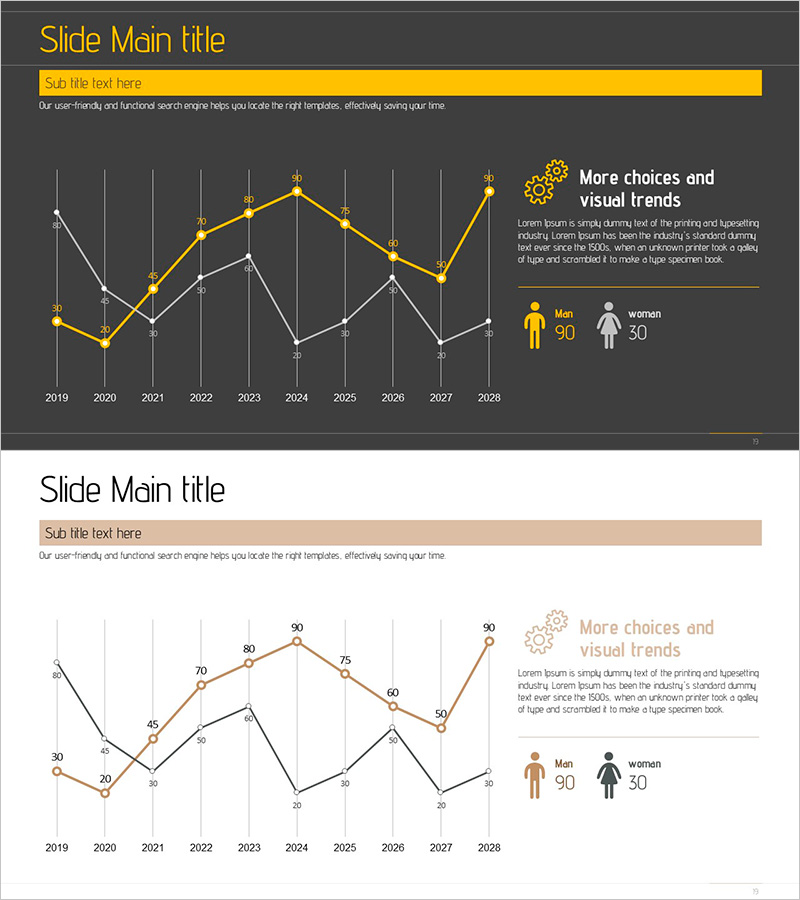
Graph Showing Investigation of Male and Female Ratio by Year
RJ0900004_18
- Last Update 08/16/2025
- File Size 0.4MB
- # of Slides 2
- File Format PPTX
- Slide Ratio 16:9
- Color
Keywords
- #Content-Based Slides
- #Design-Based Slides
- #Market and Competitor Analysis
- #Graph
- #Customer Analysis
- #Line
- #Line Chart
- #16:9
- #line chart PowerPoint slide
- #multi-series trend visualization
- #year-over-year data PowerPoint
- #demographic analysis slide
- #time series chart template
- #data visualization presentation
About the Product
A professional line chart PowerPoint slide visualizing year-over-year male and female ratio trends from 2019 to 2028. This presentation template features three data series displayed with gold and white lines against a dark gray background, creating strong visual contrast. Each data point is labeled with precise numerical values, and demographic icons with ratio information are positioned on the right side for quick interpretation. The slide design is ideal for market analysis, customer demographics, and statistical presentations requiring clear trend visualization.
Usage Points
-
Main Usage
This slide effectively communicates temporal data changes across multiple categories. It is designed to compare trends such as demographic ratios, market share evolution, or sales performance over extended periods. The labeled data points and color-coded series enable precise value communication and pattern recognition.
-
How to Use
Insert this slide into market analysis, customer demographics, or statistical reporting presentations. The dark background with gold accents conveys professionalism, making it suitable for executive briefings, investor pitches, and academic seminars. Simply replace the existing data labels and legend with your own figures for immediate use.
-
Recommended For
Marketing teams, research departments, data analysts, executives, academic researchers, and consultants presenting time-series data. Particularly effective for demographic analysis, market surveys, sales performance reports, and customer behavior trend analysis.
-
Slide Structure
Two-slide set with consistent layout. First slide features dark gray background with gold accents; second uses beige background with brown accents. Each slide contains a 10-year (2019–2028) line chart with three data series, right-aligned text area, and bottom demographic icon section with ratio information.
Related Products
-

Consumer Insights & Behavioral Patterns Analysis Slide
#Market and Competitor Analysis #Graph #Market Status
-

Customer Analysis and Bell Chart – Effective Market Insights
#Market and Competitor Analysis #Graph #Other
-

Customer Analysis Line Graph – Visualizing Market Insights
#Market and Competitor Analysis #Graph #Customer Analysis
-

Vertical Bar Chart: Life Satisfaction & Health Post-Retirement – Aging Society and New Challenges
#Market and Competitor Analysis #Graph #Customer Analysis
