Line Chart Visualizing the Trend of Eating Alone
RJ0600077_4
- Last Update 07/10/2025
- File Size 9.7MB
- # of Slides 2
- File Format PPTX
- Slide Ratio 16:9
- Color
Keywords
About the Product
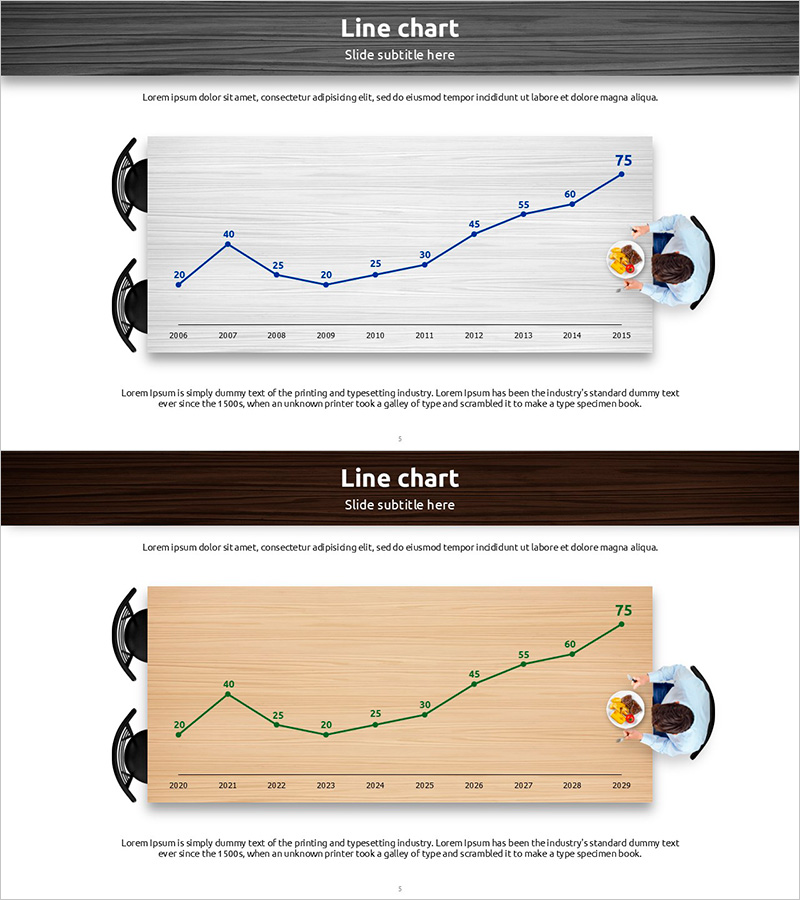
A professional PowerPoint slide featuring a line chart that visualizes the solo dining market trend from 2006 to 2015, with data points rising from 20 to 75. The slide uses a light gray background with a blue line graph, complemented by icon elements on both sides that reinforce the market analysis context. The 16:9 widescreen format ensures compatibility with modern presentation environments. This line graph template is ready to use in marketing reports, market analysis presentations, customer behavior studies, and business performance reports. Easily customize the line color, background, and data points to match your brand identity and specific analytical needs.
Usage Points
-
Main Usage
Clearly express continuous data changes over time, such as market evolution, customer behavior trends, and sales fluctuations using a line graph. The structure with 10 data points connected by a single line is optimized for long-term trend analysis and serves as a key visualization element in marketing reports and business analysis presentations.
-
How to Use
Input time-series data such as market analysis, customer behavior trends, sales performance, or market share changes. Customize the line color and background to match your corporate brand colors, or adjust the number of data points to create various trend analysis materials tailored to your specific needs.
-
Recommended For
Marketing professionals, market analysts, business executives preparing reports, management consultants, and academic presenters. Particularly useful for solo dining market analysis, food service industry trends, and consumer behavior studies. Ideal for the market overview section of business plans and investor pitch decks.
-
Slide Structure
Two-slide set. The first slide features a light gray background with a blue line graph; the second uses a warm beige wood-tone background with a green line graph, presenting the same data in different color schemes. Each slide includes 10 data points (2006–2015), Y-axis values (20–75), icon elements on both sides, and is formatted in 16:9 widescreen.
Related Products
-

Consumer Insights & Behavioral Patterns Analysis Slide
#Market and Competitor Analysis #Graph #Market Status
-

Curved Charts for Products – Visualizing Market Conditions with Diagrams
#Market and Competitor Analysis #Graph #Market Status
-

Internet Theme Segmentation Bar Graph – Market Status Analysis
#Market and Competitor Analysis #Graph #Market Status
-

Donut Chart of the Share of Real Estate Ownership – For Market Analysis
#Market and Competitor Analysis #Graph #Market Status
