Vertical Bar Chart: Life Satisfaction & Health Post-Retirement – Aging Society and New Challenges
RB0700010_4
- Last Update 03/15/2025
- File Size 0.5MB
- # of Slides 2
- File Format PPTX
- Slide Ratio 4:3
- Color
Keywords
About the Product
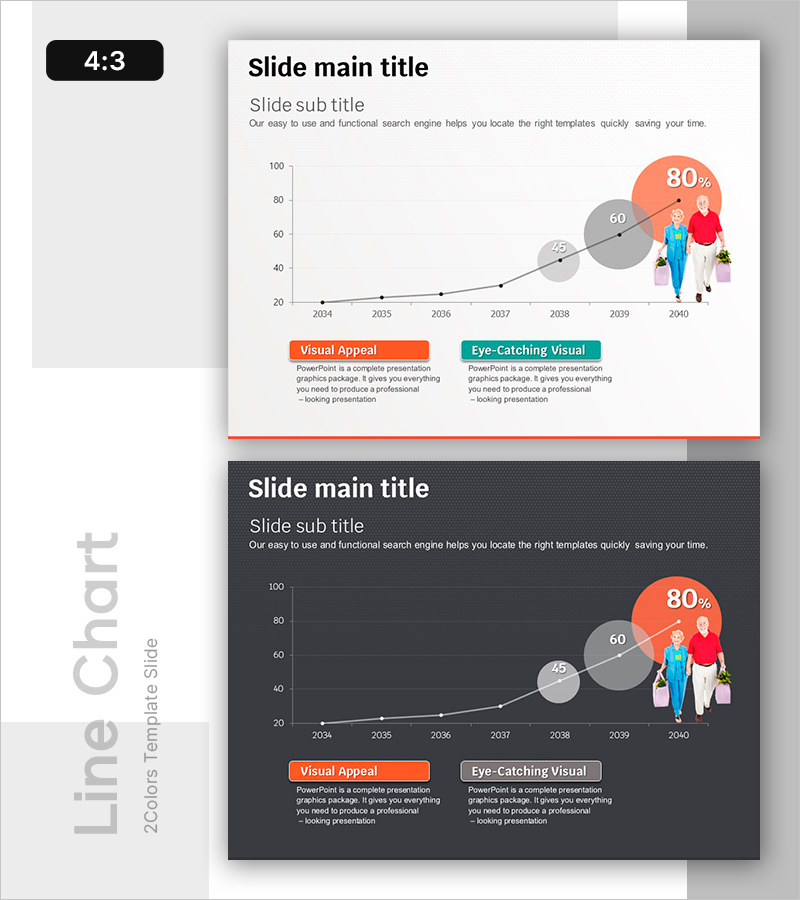
A PowerPoint slide visualizing post-retirement life satisfaction and health indicators over a 7-year period from 2034 to 2040. The design combines a line graph showing temporal trends with two circular pie charts (60%, 80%) positioned on the right to emphasize final metrics. Features orange and gray color tones, human illustrations, and two labeled text boxes (Visual Appeal, Eye-Catching Visual) for key insights. Ideal for aging society analysis, market research presentations, policy proposals, and demographic studies. Delivered in 4:3 aspect ratio PPTX format with 2 slides.
Usage Points
-
Main Usage
Dual-axis data visualization combining temporal trend analysis (line chart) with outcome proportion emphasis (pie charts). Effectively communicates both change trajectory and final-state distribution, essential for aging demographics, health policy, and social research presentations.
-
How to Use
Apply to economics, sociology, and public health presentations; government policy reports; market research findings; and elderly-focused service planning. The two text boxes enable parallel highlighting of key insights while the combined chart format tells a complete data story.
-
Recommended For
Social welfare professionals, policy makers, market researchers, healthcare planners, university researchers, NGO leaders, insurance product managers. Suitable for aging-related statistics, health indicator tracking, and quality-of-life improvement project presentations.
-
Slide Structure
Slide 1 (light background): Line graph (2034–2040, 7 data points) + two circular pie charts (60%, 80%) on right + three human figures + two labeled text boxes (orange and teal backgrounds). Slide 2 (dark background): identical layout in dark theme. 4:3 aspect ratio, 2 slides total.
Related Products
-

Consumer Insights & Behavioral Patterns Analysis Slide
#Market and Competitor Analysis #Graph #Market Status
-

Watercolor Future Market Outlook Line Graph
#Market and Competitor Analysis #Graph #Future Outlook
-

Camping Business Trend Graph – Future and Vision
#Market and Competitor Analysis #Graph #Customer Analysis
-

Line Chart of Notepad Frame – Market and Competitor Analysis
#Market and Competitor Analysis #Graph #Future Outlook
