Battery Shape Vertical Bar Graph – Competitor Analysis
RJ0400006_15
- Last Update 05/18/2025
- File Size 0.7MB
- # of Slides 2
- File Format PPTX
- Slide Ratio 16:9
- Color
Keywords
- #Content-Based Slides
- #Design-Based Slides
- #Technical Approach
- #Market and Competitor Analysis
- #Graph
- #Other
- #Future Development Roadmap
- #Market Status
- #Column
- #Column Chart
- #16:9
- #battery shape graph PowerPoint
- #vertical bar chart slide
- #competitor analysis template
- #comparison chart PPT
- #technology presentation slide
- #market analysis graph
About the Product
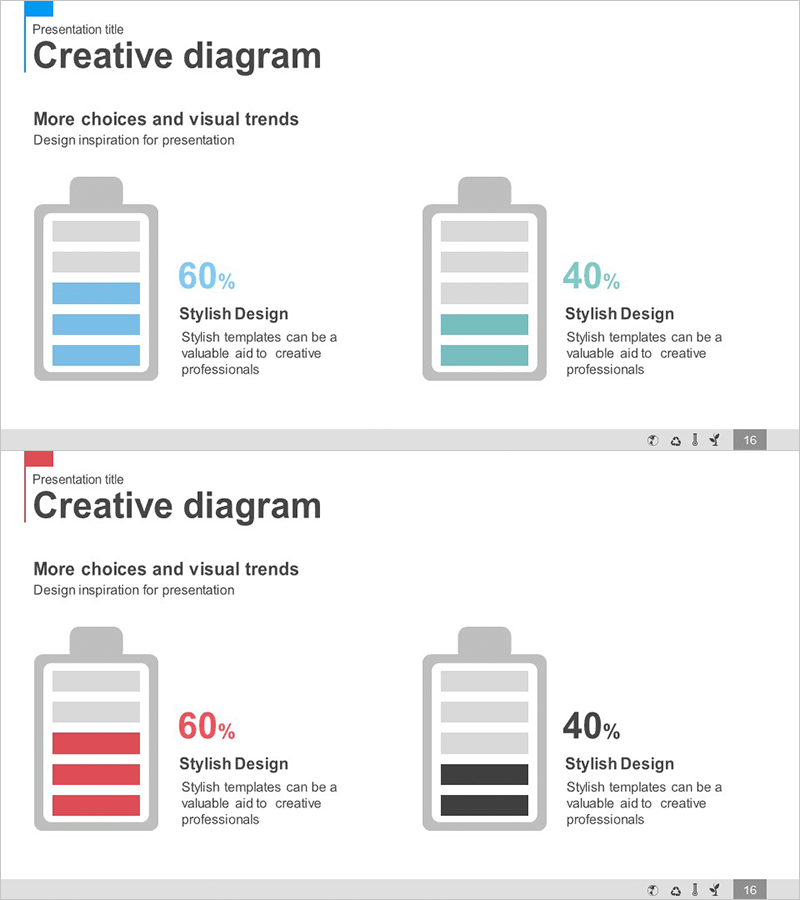
A PowerPoint slide featuring a battery-shaped vertical bar graph for visualizing competitor analysis data. The bars are color-coded in blue and red to represent comparative metrics, with battery icons on the left and numerical labels on the right for clear information delivery. This presentation slide effectively illustrates competitive positioning and market performance in technology sectors and business reports. The 16:9 PPTX format includes 2 slides ready for immediate editing and customization.
Usage Points
-
Main Usage
Visualizes competitor analysis and technology sector comparisons using battery charge states as a metaphor. The dual-color design clearly distinguishes contrasting metrics, making it ideal for technical specifications, performance benchmarks, and market share comparisons.
-
How to Use
Double-click the numerical values and labels to replace them with your actual data. Adjust the battery icon colors and bar lengths to add or modify comparison items. Insert into technology presentations, business reports, and proposals in the competitive analysis section.
-
Recommended For
Technology professionals, product managers, marketing analysts, and executives preparing competitive reports. Suitable for startup pitch decks, technology seminars, business performance reports, and market positioning presentations.
-
Slide Structure
Two-slide layout with the first slide featuring a blue-toned battery graph and the second displaying a red-toned battery graph. Each slide contains a battery icon on the left, a vertical bar representing charge status in the center, and percentage values with descriptive text on the right.
Related Products
-

Vertical Bar Graph for U.S. Market Analysis by Region – Sea Lighthouse
#Market and Competitor Analysis #Graph #Other
-

Blackboard Chalk Theme Market Analysis Graph – Creative Data Visualization
#Technical Approach #Market and Competitor Analysis #Graph
-

Horizontal Bar Chart Slide for USA Market Analysis
#Market and Competitor Analysis #Graph #Other
-

Backpacking Traveler Trends Analysis Graph – Future of Travel Industry
#Technical Approach #Market and Competitor Analysis #Graph
