Smoking Cessation Survey Slide – Market Analysis and Statistics
RJ0800019_16
- Last Update 08/04/2025
- File Size 4.2MB
- # of Slides 2
- File Format PPTX
- Slide Ratio 16:9
- Color
Keywords
About the Product
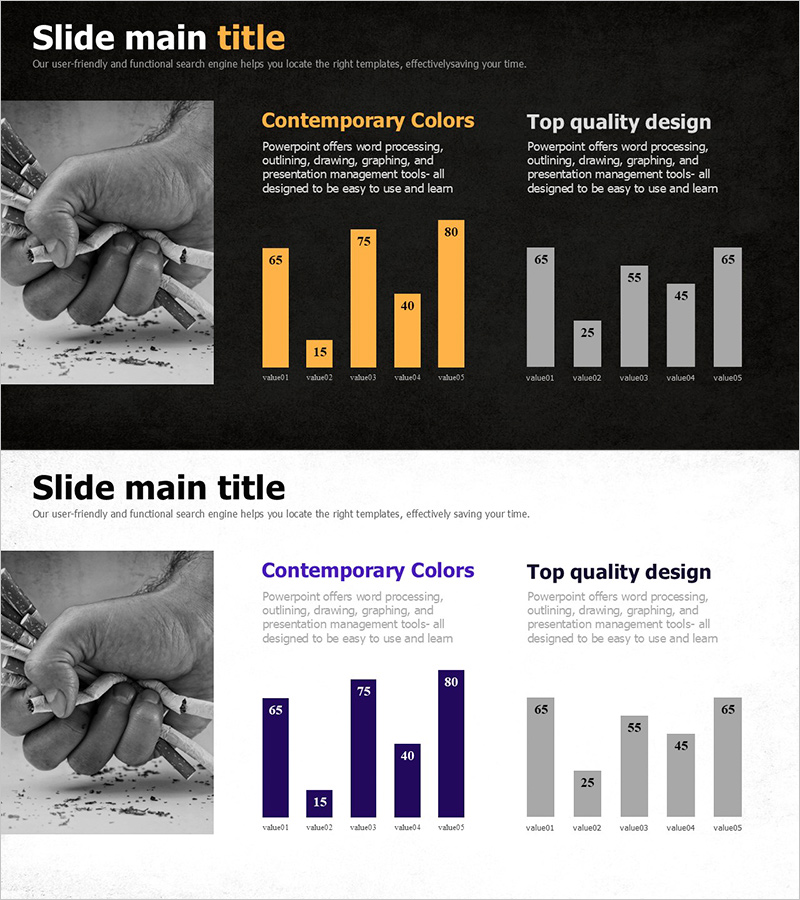
A 2-slide PowerPoint presentation designed for market analysis and statistical data visualization. Features two horizontal bar chart sets in orange and gray tones, each comparing five data points with clear numerical values. The first slide uses a dark background for modern presentation impact, while the second slide features a white background optimized for printed reports. Ideal for smoking cessation surveys, customer analysis, market research, and any quantitative comparison presentation requiring immediate deployment.
Usage Points
-
Main Usage
Visualize quantitative data comparisons across multiple items and highlight ranking differences. Ideal for market surveys, customer analysis, and statistical reports where simultaneous comparison of multiple data points is essential. Orange accent color emphasizes key metrics.
-
How to Use
Use the dark background slide for screen projection during presentations and the white background slide for printed reports or PDF distribution. Double-click each bar value to replace with your actual data, and edit item labels to match your analysis content. All elements are fully editable.
-
Recommended For
Marketing professionals, data analysts, business executives, market research specialists, and academic presenters. Recommended for anyone requiring comparative analysis such as smoking cessation surveys, consumer preferences, sales performance, and satisfaction studies.
-
Slide Structure
Slide 1: Dark background with orange bar chart (5 items, values 15–80) and gray bar chart (5 items, values 25–65), plus left-side black-and-white photograph and title area. Slide 2: White background with identical chart layout. All values and labels are fully editable.
Related Products
-

Real Estate Sales and Consumer Analysis Slide
#Market and Competitor Analysis #Graph #Market Status
-

Consumer Insights & Behavioral Patterns Analysis Slide
#Market and Competitor Analysis #Graph #Market Status
-

Business Trends and Market Status Visualization Slide Template – Ideal for Insights and Analysis
#Business Introduction #Market and Competitor Analysis #Graph
-

Horizontal Bar Chart Slide for USA Market Analysis
#Market and Competitor Analysis #Graph #Other
