Marketing Plan and Strategy Segment Vertical Bar Graph – Blue and Yellow
RJ0600002_10
- Last Update 06/21/2025
- File Size 3.6MB
- # of Slides 2
- File Format PPTX
- Slide Ratio 16:9
- Color
Keywords
- #Content-Based Slides
- #Design-Based Slides
- #Market and Competitor Analysis
- #Graph
- #Industry Trends
- #Column
- #Segmented Column
- #16:9
- #segmented vertical bar chart PowerPoint
- #stacked column chart template
- #4-item 3-series graph
- #marketing data visualization slide
- #how to create bar chart in PowerPoint
About the Product
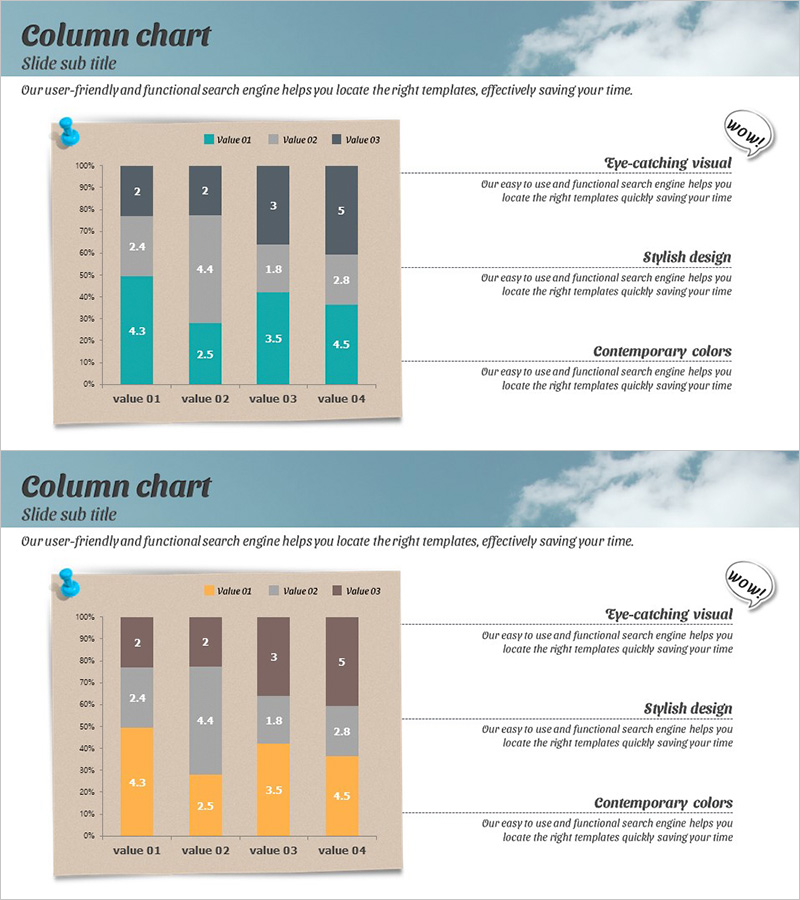
A segmented vertical bar chart PowerPoint slide designed for marketing planning and strategy presentations. This slide template enables comparison of three data series (Value 01, 02, 03) across four items (Value 01 through 04), allowing detailed analysis of segmented numerical values. The contrasting blue and yellow color scheme distinguishes data series, with numerical labels displayed above each bar segment for precise value communication. Formatted in 16:9 widescreen ratio with 2 slides in editable PPTX format. Ideal for market analysis, competitive comparison, sales performance review, and multi-dimensional data visualization in business presentations.
Usage Points
-
Main Usage
This slide is designed to compare multiple data series across several items simultaneously during marketing strategy development. It effectively visualizes market segmentation, customer group sales, channel performance, and competitive benchmarking, enabling audiences to intuitively grasp differences between items and data series.
-
How to Use
Data values are represented by bar height and color, with numerical labels providing exact figures. During presentation, emphasize specific items or series by intensifying bar colors or adding animations. Use the legend to clarify each series' meaning, and add supplementary text annotations on the right side as needed. Customize colors and values to match your specific data.
-
Recommended For
Marketing managers, sales directors, business analysts, market research professionals, and strategic planning teams. Particularly effective for quarterly or monthly performance comparisons, regional or channel-based analysis, customer segment revenue reporting, and multi-category data presentations.
-
Slide Structure
Comprises 2 slides, each featuring 4 vertical bars representing the 4 items with 3 color-coded segments per bar for the 3 data series. Numerical labels (2, 2.4, 4.3, etc.) appear above each segment. Y-axis ranges from 0 to 100% with gridlines. Color legend positioned at top right. Icon element at top left with descriptive text area on the right side of the chart.
Related Products
-

Pork Consumption Stack Chart – Market Trend Analysis
#Market and Competitor Analysis #Graph #Market Analysis
-

Graph of Changes After a Healthy Diet – Data Visualization Template
#Market and Competitor Analysis #Graph #Market Analysis
-

Target Analysis Subdivided Vertical Bar Graph – Harmonizing Blue and Green
#Market and Competitor Analysis #Graph #Customer Analysis
-

Visualizing Percentage of Product Sales by Period with Bar Charts – Market and Revenue Analysis
#Market and Competitor Analysis #Financial Plans and Performance #Graph
