Red Green Market Analysis Slide – Effective Data Visualization
RJ0600082_17
- Last Update 07/12/2025
- File Size 0.2MB
- # of Slides 2
- File Format PPTX
- Slide Ratio 16:9
- Color
Keywords
- #Content-Based Slides
- #Design-Based Slides
- #Business Strategy
- #Market and Competitor Analysis
- #Diagram
- #Graph
- #Achievements
- #Industry Trends
- #Table
- #Column
- #Standard Table
- #Segmented Column
- #16:9
- #stacked column chart PowerPoint
- #year-over-year comparison slide
- #market analysis PowerPoint template
- #data visualization chart
- #business performance slide
- #how to create stacked bar chart in PowerPoint
About the Product
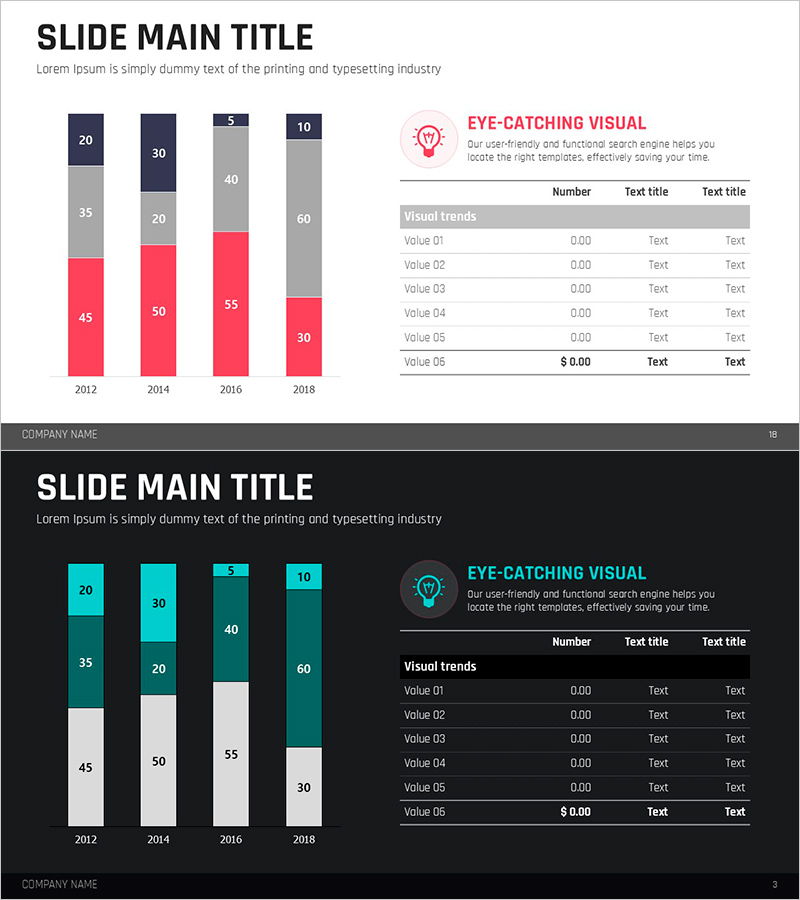
A stacked column chart PowerPoint slide visualizing data changes across four years from 2012 to 2018. Three color-coded segments (red, gray, blue) in each bar enable simultaneous comparison of year-over-year values and compositional ratios. A data table on the right side organizes key metrics, making this slide ideal for market analysis presentations, performance reports, and business strategy discussions. Delivered in 16:9 widescreen PPTX format with 2 fully editable slides.
Usage Points
-
Main Usage
Displays year-over-year or period-over-period data trends using stacked bar segments, enabling simultaneous communication of absolute values and compositional percentages. Supports credible quantitative storytelling in market analysis, revenue performance, and business initiative status reports.
-
How to Use
Edit bar heights, color segments, and numeric labels with your own data. Input key metrics (Value 01–06) into the right-side table to maintain visual-numeric consistency. Ready for direct application in business reports, marketing proposals, and investor presentations.
-
Recommended For
Finance, planning, and marketing professionals; business performance report owners; market analysis presenters; investor relations managers; and executive briefing teams requiring quantitative data-driven presentations. Particularly effective for year-over-year, quarterly, or regional comparative analysis.
-
Slide Structure
Four stacked columns (2012–2018) on the left, each divided into 3–4 color-coded segments with numeric labels. Right side features a 6-row × 3-column data table with Value 01–06 rows and text input fields. Overall layout: left chart + right information panel in two-column arrangement.
Related Products
-

Natural Vertical Bar Segment Chart – A Key Tool for Market Analysis
#Business Strategy #Market and Competitor Analysis #Graph
-

Structure Presentation Template Segmented Vertical Bar Graph – Market Trends and Performance Analysis
#Market and Competitor Analysis #Financial Plans and Performance #Diagram
-

Comparison Chart of Pet Expenditure – Essential Template for Competitor Analysis
#Market and Competitor Analysis #Diagram #Graph
-

Business Trend Graph by Year – Market Analysis Insight
#Market and Competitor Analysis #Financial Plans and Performance #Diagram
