Schedule and Review Plan Diagram – Effective Business Execution
RJ0600016_7
- Last Update 06/25/2025
- File Size 0.3MB
- # of Slides 2
- File Format PPTX
- Slide Ratio 16:9
- Color
Keywords
- #Content-Based Slides
- #Design-Based Slides
- #Business Strategy
- #Business Management
- #Diagram
- #Implementation Framework
- #Reporting and Review Plan
- #Flow
- #Table
- #Linear Flow
- #Standard Table
- #16:9
- #circular diagram PowerPoint
- #3-stage process slide
- #business schedule template
- #review plan diagram PowerPoint
- #how to create process diagram in PowerPoint
About the Product
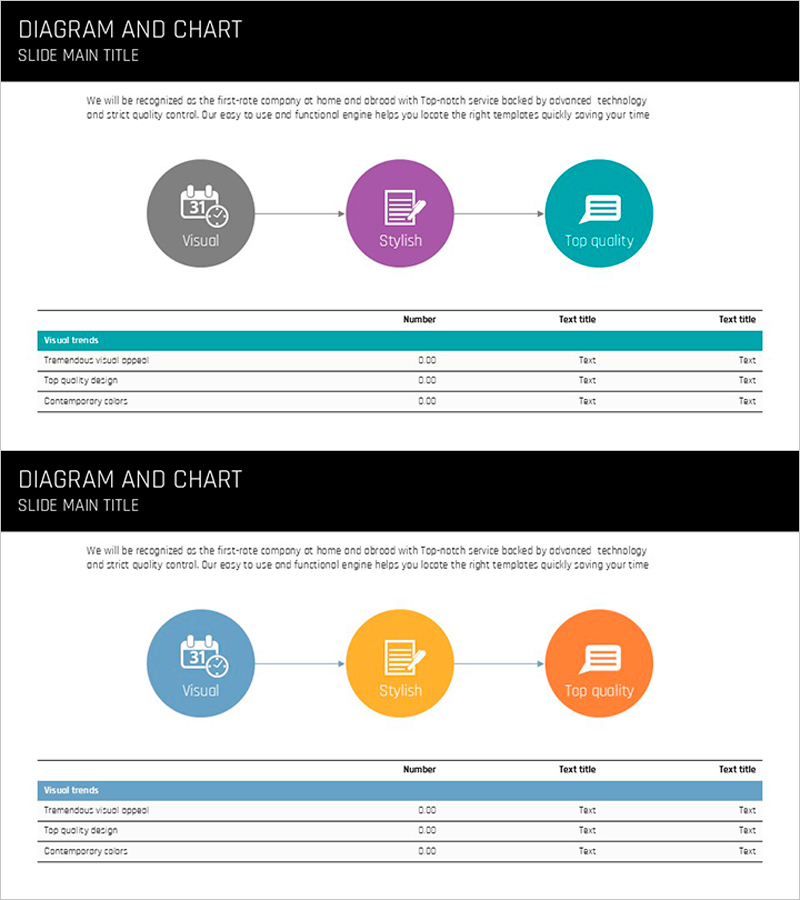
A 3-stage circular diagram PowerPoint slide designed to visualize business execution schedules and review planning processes. The left side features a flow diagram with gray, purple, and teal circular nodes connected by arrows, while the right side includes a data table for detailed information. Each stage is labeled with icons (Visual, Stylish, Top quality) to enhance clarity and enable intuitive communication of project milestones and quality checkpoints. This PPT diagram slide is ready to use in business plans, reports, proposals, and executive presentations.
Usage Points
-
Main Usage
Clearly visualizes the cyclical flow of project or business execution schedules alongside review checkpoints at each stage. The three-stage circular design with icons and connecting arrows emphasizes process continuity, while the accompanying data table on the right enables detailed tracking of timelines, review items, and responsibilities to support strategic decision-making.
-
How to Use
Enter project phase names and responsible departments in the left circular diagram, then populate the right table with schedules, review items, and assigned personnel. Customize colors to represent stage priorities or replace icons to reflect specific business characteristics. Insert into business plan strategy sections or project management pages in reports and presentations.
-
Recommended For
Project managers, business planning teams, marketing professionals, and consultants presenting business execution schedules and review timelines. Ideal for business plans, proposals, investment pitches, performance reports, and strategic planning documents where process visualization and timeline management are critical.
-
Slide Structure
Two-slide set: The first slide features a circular flow diagram with three colored nodes (gray, purple, teal) connected by directional arrows. The second slide combines the same diagram with a teal-header data table (3 rows × 3 columns) for detailed information. Both slides are formatted in 16:9 widescreen ratio for modern presentation environments.
Related Products
-

Construction Company System Chart - Business Strategy and Operation Plan
#Business Strategy #Operational Plan #Diagram
-

Business Promotion System Diagram – Emphasizing Strategic Steps
#Product/Service Introduction #Business Strategy #Diagram
-

Diagram Slide Connecting Business Strategy
#Business Strategy #Diagram #Implementation Framework
-

Triangular Pattern Presentation Template Step Diagram
#Business Management #Operational Plan #Diagram
