Line Chart of the Violence Survey – Market Analysis and Competitive Advantage
RJ0500040_15
- Last Update 06/18/2025
- File Size 0.5MB
- # of Slides 2
- File Format PPTX
- Slide Ratio 16:9
- Color
Keywords
About the Product
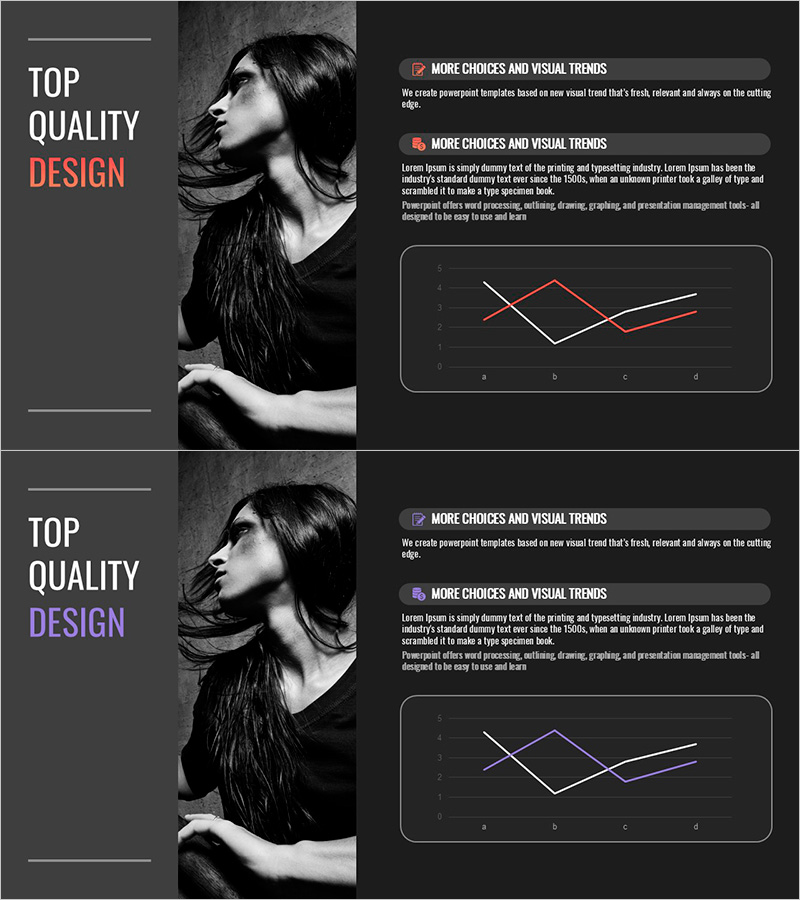
A professional line chart PowerPoint slide for visualizing market analysis and competitive advantage. The dark background features three intersecting trend lines in red, white, and purple, clearly representing data changes across multiple series. The 2-slide set provides identical layouts for consistent presentation flow. Each series tracks numerical fluctuations across four data points, enabling comparative analysis of performance metrics, market trends, and competitor benchmarking. Ideal for business presentations, reports, and strategic planning documents where multi-series trend visualization is essential.
Usage Points
-
Main Usage
Visualize time-based data trends across three simultaneous series for comparative analysis. Effectively displays market performance, competitor benchmarking, sales trends, and key performance indicators in a single, easy-to-read format.
-
How to Use
Insert into the analysis or results section of your presentation to explain numerical changes over time. Customize line colors to match your data, update axis labels and legend entries, and immediately deploy in your presentation without additional design work.
-
Recommended For
Executives, marketing teams, sales professionals, data analysts, and consultants presenting business performance, market trends, and competitive analysis. Suitable for quarterly earnings reports, strategy meetings, investor presentations, and academic research presentations.
-
Slide Structure
2-slide set with identical line chart layouts. Each slide features an X-axis with four data points (A–D), Y-axis scaled 0–5, and three intersecting trend lines in distinct colors. White gridlines on dark background provide clear contrast and readability.
Related Products
-

Line Chart for Visualizing Data Changes – Effective Information Delivery
#Market and Competitor Analysis #Graph #Market Analysis
-

Segmented Bar Graph and Line Graph – Ideal for Market Analysis
#Market and Competitor Analysis #Graph #Market Analysis
-

Trend Visualization of Surgery for Market and Competitive Analysis
#Market and Competitor Analysis #Graph #Market Analysis
-

Customer Analytics Bell Diagram – Competitive Advantage Analysis
#Market and Competitor Analysis #Graph #Market Analysis
