Vehicle Sales Trends Visualized with Horizontal Bar Chart
RJ0800052_8
- Last Update 08/15/2025
- File Size 1MB
- # of Slides 2
- File Format PPTX
- Slide Ratio 16:9
- Color
Keywords
- #Content-Based Slides
- #Design-Based Slides
- #Market and Competitor Analysis
- #Financial Plans and Performance
- #Graph
- #Industry Trends
- #Sales and Revenue
- #Horizontal Bar
- #16:9
- #horizontal bar chart PowerPoint
- #bar chart slide design
- #data comparison PPT
- #sales trend visualization slide
- #financial data chart PowerPoint
About the Product
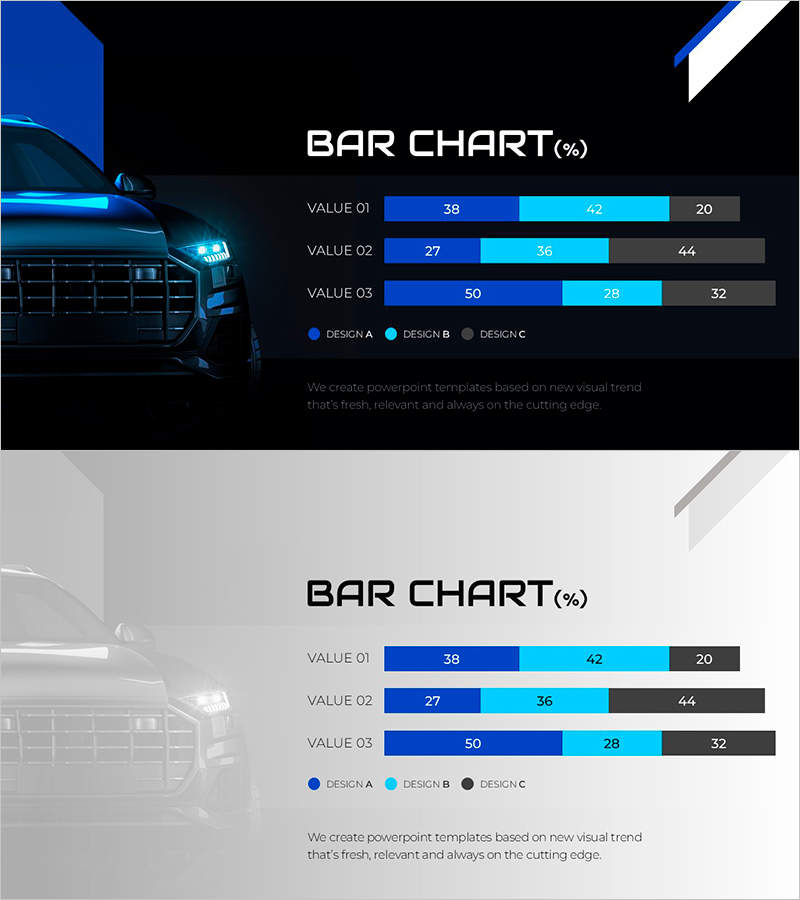
A horizontal bar chart PowerPoint slide that visualizes vehicle sales trends across three comparative values. The slide uses a dark blue, light blue, and charcoal color scheme to distinguish data segments, clearly displaying the percentage distribution for VALUE 01, VALUE 02, and VALUE 03. Formatted in 16:9 widescreen with 2 slides, featuring a vehicle image on the left and chart layout on the right. Ready for immediate use in financial reports, market analysis presentations, and sales performance briefings.
Usage Points
-
Main Usage
Clearly presents numerical comparisons of three data points using horizontal bar visualization, enabling quick comprehension of financial performance, sales trends, and market share metrics in executive presentations.
-
How to Use
Deploy in financial report sections for sales analysis, market analysis materials for competitive benchmarking, IR presentations for performance metrics, and strategic business meetings requiring data-driven insights.
-
Recommended For
CFO and finance teams presenting quarterly earnings, marketing teams reporting market analysis, executive leadership in strategy sessions, and investor presentations requiring financial performance visualization.
-
Slide Structure
2-slide set with title area, legend section, and three horizontal bar chart rows per slide. Two-column layout separates vehicle imagery on the left from chart visualization on the right, creating clear information hierarchy.
Related Products
-

Stacked Bar Graph by Year with Detailed Breakdown - Market Analysis Insights
#Market and Competitor Analysis #Financial Plans and Performance #Graph
-

Market Trends Visualized with Stacked Graph – Sales Performance and Competitive Analysis
#Market and Competitor Analysis #Financial Plans and Performance #Graph
-

Comparison of Fruit Consumption – Market Trend Analysis
#Market and Competitor Analysis #Financial Plans and Performance #Graph
-

Horizontal Bar Chart Visualizing Herb Tea Sales Trends
#Market and Competitor Analysis #Financial Plans and Performance #Graph
