Market Trends Visualized with Stacked Graph – Sales Performance and Competitive Analysis
RB0800009_10
- Last Update 03/19/2025
- File Size 3.3MB
- # of Slides 2
- File Format PPTX
- Slide Ratio 4:3
- Color
Keywords
- #Content-Based Slides
- #Design-Based Slides
- #Market and Competitor Analysis
- #Financial Plans and Performance
- #Graph
- #Industry Trends
- #Sales and Revenue
- #Horizontal Bar
- #Segmented Horizontal Bar
- #4:3
- #stacked bar chart PowerPoint
- #horizontal bar graph slide
- #3-color data visualization
- #sales comparison PowerPoint slide
- #market analysis chart template
- #multi-series data presentation
About the Product
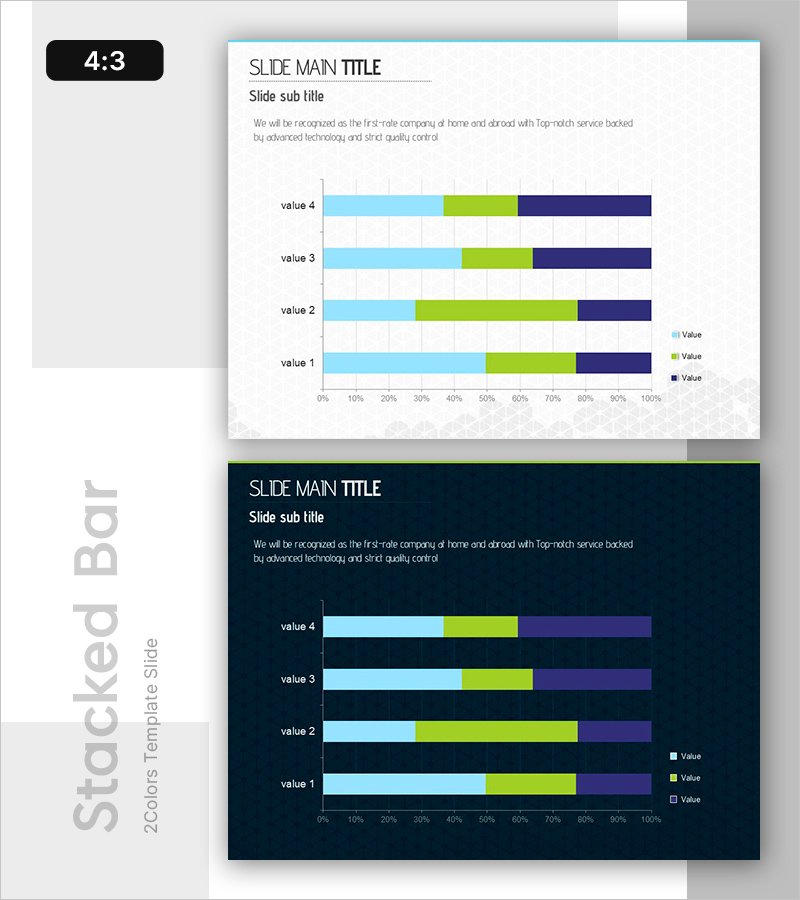
A stacked horizontal bar chart PowerPoint slide designed to visualize market trends and financial performance side by side. This presentation template features three data series in light blue, lime green, and dark navy, displaying comparative metrics across four items (value 1–4). Each bar segment represents a percentage-based data series, allowing simultaneous visualization of composition ratios and absolute values. Two design versions—light background and dark background—are included for flexible use in competitive analysis, sales reporting, market share analysis, and business performance presentations.
Usage Points
-
Main Usage
This slide excels at comparing composition ratios and absolute values across multiple items simultaneously. The stacked structure clearly shows the contribution of three data series within each item, while the percentage-based horizontal axis intuitively conveys proportional relationships. Ideal for competitive benchmarking, quarterly sales trends, market share distribution, and product category revenue analysis.
-
How to Use
Input data values into the slide master, and bar lengths adjust automatically. Each color series is customizable via RGB values, and legend labels and axis titles can be modified to match your document context. The light background version suits printed materials, while the dark version is optimized for projector presentations.
-
Recommended For
Recommended for finance teams presenting quarterly earnings, marketing teams analyzing market segments, sales teams conducting competitive analysis, and executive-level performance reporting. Particularly effective when comparing three or more data series, and applicable to academic presentations and consulting proposals.
-
Slide Structure
Two-slide template with contrasting designs: slide 1 features a light gray background with black text; slide 2 uses dark navy background with white text. Each slide displays four horizontal stacked bars (value 1–4) with a 0–100% horizontal axis and a three-color legend. Formatted in 4:3 ratio PPTX for full editability.
Related Products
-

Stacked Bar Graph by Year with Detailed Breakdown - Market Analysis Insights
#Market and Competitor Analysis #Financial Plans and Performance #Graph
-

Comparison of Fruit Consumption – Market Trend Analysis
#Market and Competitor Analysis #Financial Plans and Performance #Graph
-

Four Color Infographic Bar Chart Presentation Template for Financial Analysis
#Market and Competitor Analysis #Financial Plans and Performance #Graph
-

National Trend Change Graph Visualization – Horizontal Bar Chart
#Market and Competitor Analysis #Graph #Other
