Graph of Food Consumption Ratio by Country – Market Share Analysis
RJ0800051_20
- Last Update 08/14/2025
- File Size 0.6MB
- # of Slides 2
- File Format PPTX
- Slide Ratio 16:9
- Color
Keywords
About the Product
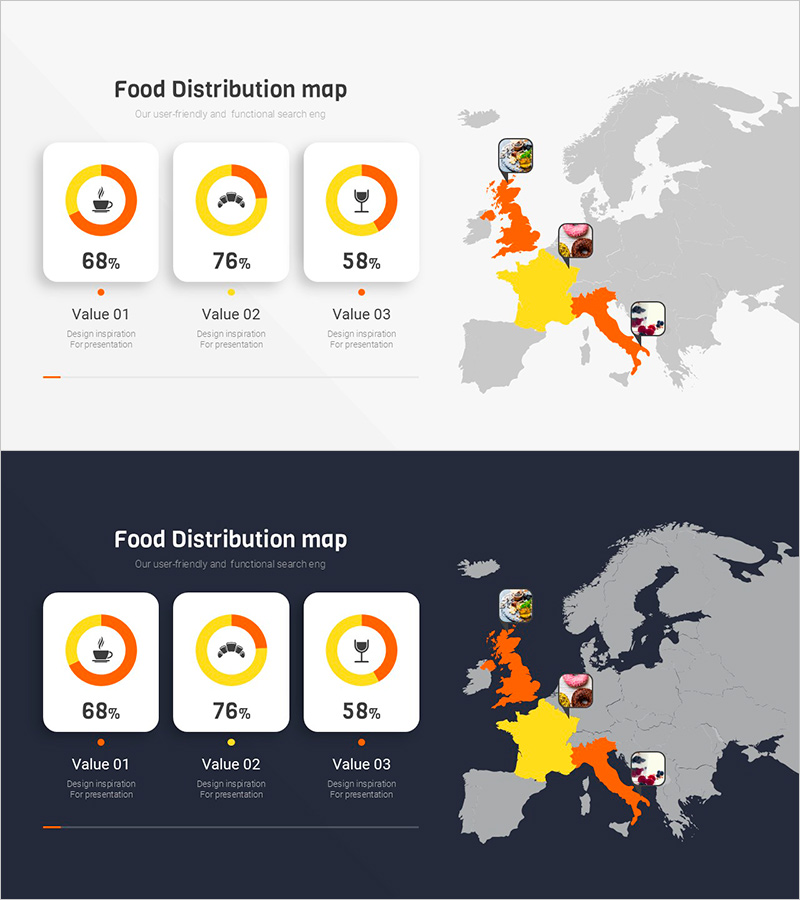
A PowerPoint slide that visualizes food consumption ratios by country against a European map background. Available in two versions: light background and dark background, with food icons and percentage figures displayed for each country. Regional data highlighted in yellow and orange is represented through circular chart icons, making market share comparisons intuitive at a glance. This presentation slide is ready for immediate use in reports and presentations, optimized for regional market analysis and competitive comparison sections.
Usage Points
-
Main Usage
Visualizes regional and country-level market share, consumption patterns, and competitive analysis using a map-based layout. Ideal for food, beverage, distribution, and marketing industries to communicate regional comparison data intuitively in market analysis sections.
-
How to Use
Replace the percentage figures and country names shown on the slide with your own data. The light background version suits printed materials, while the dark background version works better for projector presentations. Map colors and icons can be customized to match your corporate brand colors.
-
Recommended For
Recommended for marketing plans, business reports, investor presentations, and market analysis talks when comparing regional consumption data. Suitable for food and beverage, distribution, and retail industry professionals, marketing teams, and executive briefing materials.
-
Slide Structure
Two-slide layout with each slide featuring a European map background displaying three countries (UK, France, Italy) with food icons and percentage figures. Left side shows three metric cards with circular charts (68%, 76%, 58%), while the right side displays the map and food photos in a comparative layout.
Related Products
-

Market Analysis with World Map and Percentage Data
#Market and Competitor Analysis #Other #Market Share
-

Target Country Market Share Analysis Graph
#Market and Competitor Analysis #Graph #Other
-

Market Analysis Slide for Major European Exporters
#Company Introduction #Market and Competitor Analysis #Graph
-

Donut Chart & Map Template for Social Network Visualization
#Market and Competitor Analysis #Graph #Other
