Trends in Visits to Traditional Villages – Data Visualization of Market Status
RJ0800050_26
- Last Update 08/14/2025
- File Size 1.1MB
- # of Slides 2
- File Format PPTX
- Slide Ratio 16:9
- Color
Keywords
- #Content-Based Slides
- #Design-Based Slides
- #Market and Competitor Analysis
- #Financial Plans and Performance
- #Graph
- #Market Status
- #Sales and Revenue
- #16:9
- #multi-line graph PowerPoint slide
- #market trends visualization PPT
- #5-year data chart template
- #how to create trend analysis in PowerPoint
- #business report slide design
About the Product
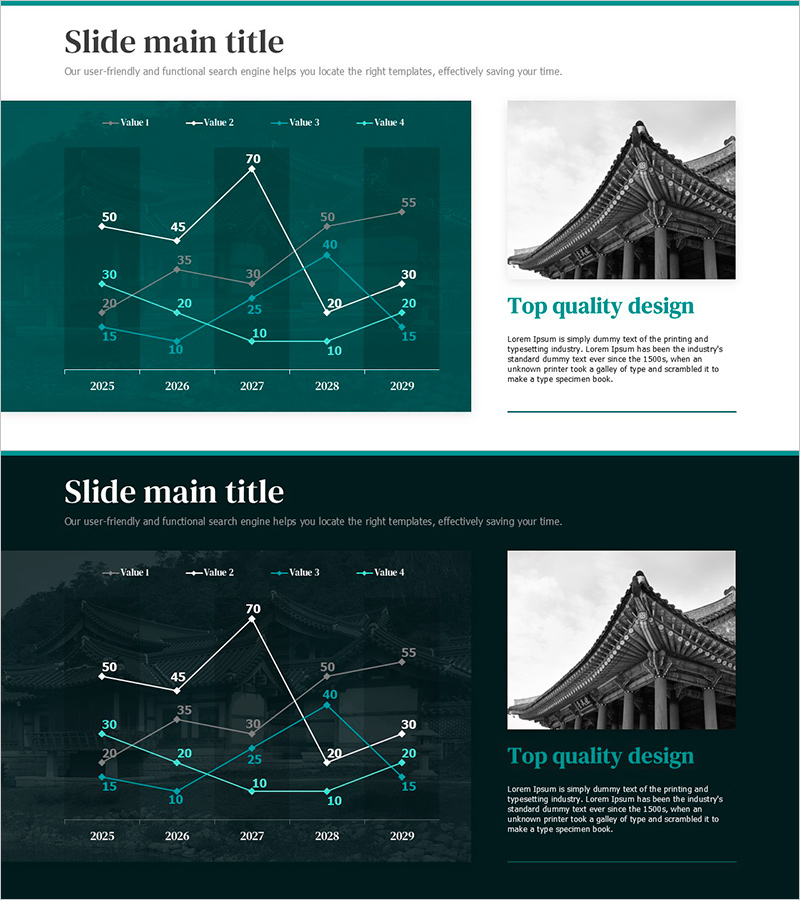
A multi-line graph PowerPoint slide designed for market status analysis and data visualization. This presentation template displays five years of data (2025–2029) across four data series on a teal background with white trend lines. The right side features an image placeholder and text description area for qualitative insights. Ideal for business reports, market analysis presentations, and strategic decision-making slides where numerical trends need clear visual representation.
Usage Points
-
Main Usage
Compare multiple data series over time and communicate market status objectively through visual trend analysis. This slide enables simultaneous tracking of four metrics to analyze competitive positioning, market share evolution, customer visit patterns, and other complex performance indicators.
-
How to Use
Input your actual data into the left graph area, insert relevant images or logos in the right image placeholder, and add key insights in the text description box. During presentation, emphasize rising and falling points on the graph while explaining business implications to enhance audience comprehension.
-
Recommended For
Market analysts, business planners, finance managers, and marketing directors preparing quarterly or annual performance reports, market trend analysis, and investment proposals. Particularly valuable for tourism, consumer goods, and service industries tracking demand fluctuations over time.
-
Slide Structure
Left two-thirds contains a multi-line graph with four data series legend and five years of data points; right one-third features an image box (top) and text description box (bottom). Title area positioned at the top clearly identifies the slide topic.
Related Products
-

Column Chart for PowerPoint – Visualization of Market Analysis and Performance
#Market and Competitor Analysis #Financial Plans and Performance #Graph
-

Stylish Comparative Column Graph – Market Status and Performance Comparison
#Market and Competitor Analysis #Financial Plans and Performance #Graph
-

AI VC Market Statistics PowerPoint Slide – Bar Chart and KPI
#Market and Competitor Analysis #Financial Plans and Performance #Graph
-

Analysis of Ship Order Volume – Effective Market Status Graph
#Market and Competitor Analysis #Financial Plans and Performance #Graph
