Chart Analysis of Green Areas – A New Approach to Data Visualization
RJ0800050_21
- Last Update 08/14/2025
- File Size 0.3MB
- # of Slides 2
- File Format PPTX
- Slide Ratio 16:9
- Color
Keywords
About the Product
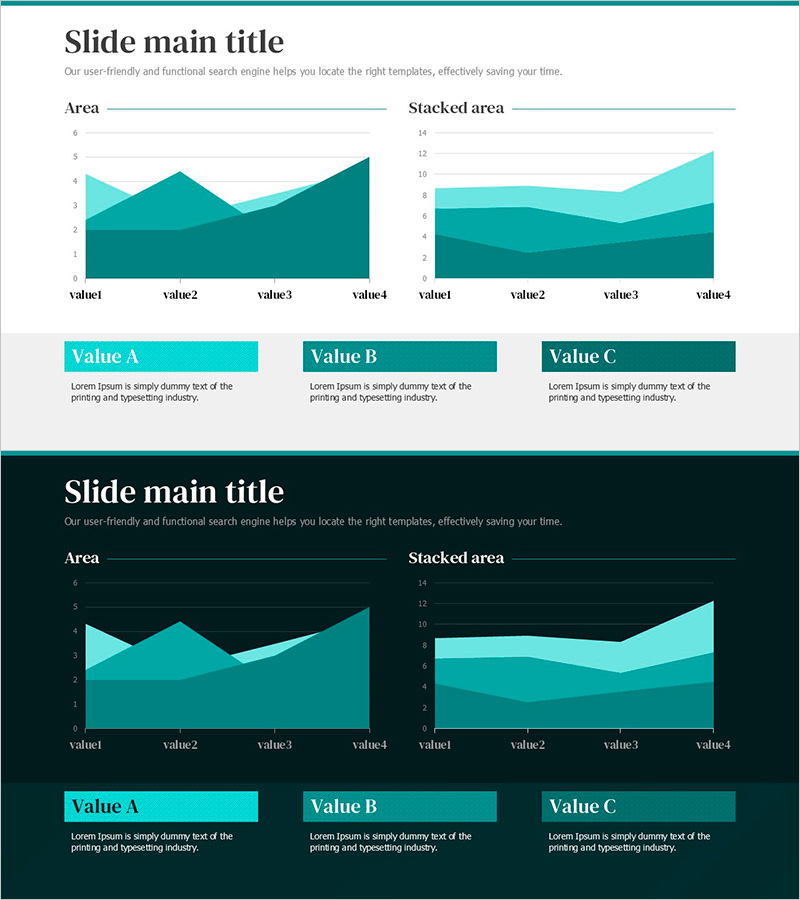
A multi-series area chart PowerPoint slide that visualizes complex data trends over time. Three data series are displayed in a teal color gradient, from light cyan to deep teal, stacked to show both individual trends and cumulative composition. The template includes two chart layouts: a standard area chart and a stacked area chart, each with a legend section at the bottom for three data categories. Ideal for presentations, reports, and business analysis where you need to communicate financial performance, sales trends, market share, or operational metrics across multiple dimensions simultaneously.
Usage Points
-
Main Usage
Displays multiple data series over time while showing both individual values and cumulative totals. Stacked area charts are particularly effective for illustrating how different components contribute to an overall trend, making them ideal for revenue breakdowns, channel performance analysis, cost allocation, and resource distribution across organizational units.
-
How to Use
Select between the standard area chart (left) and stacked area chart (right) based on your data characteristics. Edit the legend labels and axis values to input your actual data. Customize the color gradient if needed to match your brand guidelines. Add key insights and interpretations in the three legend boxes at the bottom to enhance audience comprehension.
-
Recommended For
Finance teams presenting quarterly or annual performance reports, marketing teams analyzing channel-specific results, sales teams showcasing regional or product-line trends, executive leadership reviewing business performance, and consulting firms presenting market analysis. Most effective when comparing three or more categories across multiple time periods.
-
Slide Structure
Two-slide template. Each slide features a standard area chart on the left and a stacked area chart on the right, both displaying four data points. Bottom section contains three color-coded legend boxes (light teal, medium teal, dark teal) with corresponding description text areas. 16:9 widescreen format, fully editable.
Related Products
-

Blue Green Double Bar Graph – Perfect for Market Analysis
#Market and Competitor Analysis #Graph #Competitor Analysis
-

Target Country Year-by-Year Analysis Chart – Data Visualization for Market Analysis
#Market and Competitor Analysis #Graph #Other
-

Competitor Analysis Graph & Table by Year
#Market and Competitor Analysis #Diagram #Graph
-

SNS Main Service Analysis 3D Area Graph – Market Status and Competitive Advantage
#Market and Competitor Analysis #Graph #Other
