Target Performance and Expected Results – Visualized with Vertical Bar Charts
RB0100041_5
- Last Update 03/05/2025
- File Size 0.9MB
- # of Slides 2
- File Format PPTX
- Slide Ratio 4:3
- Color
Keywords
- #Content-Based Slides
- #Design-Based Slides
- #Business Strategy
- #Graph
- #Financial Outlook & Expected Impact
- #Achievements
- #Column
- #Column Chart
- #4:3
- #vertical bar chart PowerPoint
- #bar graph presentation slide
- #performance comparison chart
- #target achievement visualization
- #data chart PowerPoint template
About the Product
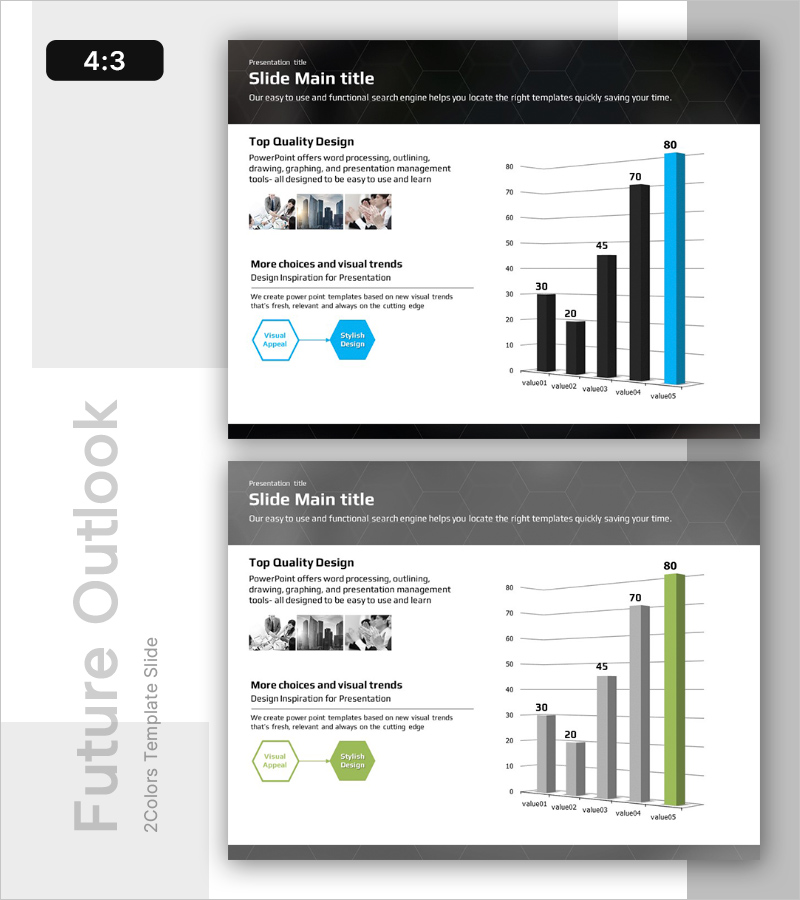
A PowerPoint slide that visualizes target achievement and expected results using a 5-item vertical bar chart. Black and blue contrasting bars clearly compare actual performance against targets, with horizontal gridlines for easy value reading. This presentation template is ready to use for business strategy reports, performance reviews, and impact analysis where quantitative data visualization is essential. The 4:3 aspect ratio with 2-slide layout makes editing straightforward and professional.
Usage Points
-
Main Usage
Visualizes quantitative data comparison across 5 items and performance metrics. Bar heights represent numerical values for intuitive relative size comparison, while black and blue contrasting bars emphasize the gap between actual results and targets with clarity.
-
How to Use
Use in business strategy presentations, quarterly or annual performance reports, goal achievement analysis, and expected impact explanations. Edit bar heights and colors to input actual data, modify legend and axis labels, then the slide is ready for immediate presentation use.
-
Recommended For
Executive and management reporting, business unit performance analysis presentations, marketing and sales team goal achievement briefings, finance and planning team quantitative analysis materials. Particularly valuable for quarterly performance reviews and annual business planning sessions.
-
Slide Structure
2-slide layout. First slide features black header with title and description text, three images on the left, and a 5-item vertical bar chart on the right (value01 through value05 with values 30, 20, 45, 70, 80). Second slide has gray header background with identical layout plus two hexagon text boxes (Visual Appeal and Stylish Design). 4:3 aspect ratio, PPTX format.
Related Products
-

Flower Wide PPT Vertical Bar Graph – Performance and Expectations
#Business Strategy #Graph #Financial Outlook & Expected Impact
-

Mountain Climbing Goals Market Strategy Vertical Bar Chart
#Business Strategy #Diagram #Graph
-

Growth Vertical Bar Graph – Performance and Expectations
#Business Strategy #Graph #Financial Outlook & Expected Impact
-

Vertical Bar Chart for Achieving Goals – Growth and Fulfillment
#Business Strategy #Graph #Financial Outlook & Expected Impact
