Social Network Target Market Analysis – Insights and Strategies
RJ0400068_24
- Last Update 06/05/2025
- File Size 0.7MB
- # of Slides 2
- File Format PPTX
- Slide Ratio 16:9
- Color
Keywords
- #Content-Based Slides
- #Design-Based Slides
- #Product/Service Introduction
- #Market and Competitor Analysis
- #Graph
- #Other
- #Development Status
- #Target Market
- #Circles
- #Doughnut Chart
- #16:9
- #donut chart PowerPoint
- #pie chart slide template
- #ratio analysis presentation
- #market analysis chart
- #data visualization slides
About the Product
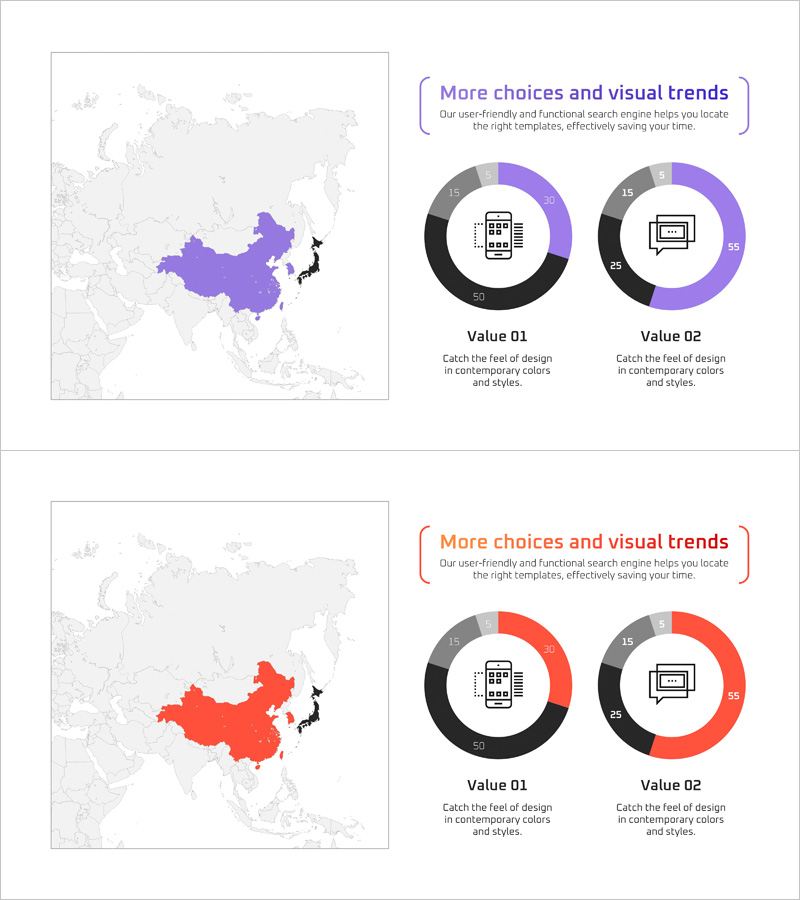
A professional donut chart PowerPoint slide designed for social network market analysis and target customer segmentation. Features two donut-shaped pie charts in purple and red dual-tone colors, with icons and numerical values centered within each chart for intuitive data ratio visualization. Includes a world map background highlighting regional market share, competitive comparison, and customer preference distribution. Formatted in 16:9 widescreen with 2 slides ready for immediate editing and presentation use.
Usage Points
-
Main Usage
Ideal for visualizing social network market analysis, target customer segmentation, regional market share comparison, competitive performance benchmarking, and customer preference survey results. The centered space within donut charts allows emphasis of key metrics or icons, making data interpretation clear and impactful.
-
How to Use
Use slide 1 with the world map background and purple donut charts to present primary market data. Apply slide 2 with red donut charts for comparative analysis. Edit numerical values and legends to reflect actual research findings. Customize colors and icons to align with brand guidelines as needed.
-
Recommended For
Marketing managers, business strategy teams, market research analysts, sales executives, and investment pitch presenters seeking to communicate customer segmentation, market share, and competitive positioning. Particularly effective for global market expansion strategies, new business proposals, and quarterly performance reports.
-
Slide Structure
Slide 1: World map background (China & Japan highlighted) + 2 purple donut charts (2-segment each) + centered icons and metrics. Slide 2: Matching background + 2 red donut charts (2-segment each) + centered icons and metrics. Each chart is independently editable with flexible legend and label placement.
Related Products
-

Graph of the Development Status of the Target Market – Visuals for Market Analysis
#Product/Service Introduction #Market and Competitor Analysis #Graph
-

Target Market Analysis Graph – Visualized Data Insights
#Product/Service Introduction #Market and Competitor Analysis #Graph
-

Share Chart by Region – Market Analysis Tool
#Market and Competitor Analysis #Graph #Other
-

Lighting Graph – Market Share and Target Analysis
#Market and Competitor Analysis #Graph #Other
